
What is an HR Attrition Dashboard?
An HR Attrition Dashboard helps HR teams track and analyze employee turnover patterns. It brings together key metrics like attrition rates, reasons for departure, and demographic details, offering a centralized view of workforce dynamics. This employee attrition dashboard is crucial for understanding employee movement and developing data-driven retention strategies.
HR Attrition Dashboard Example
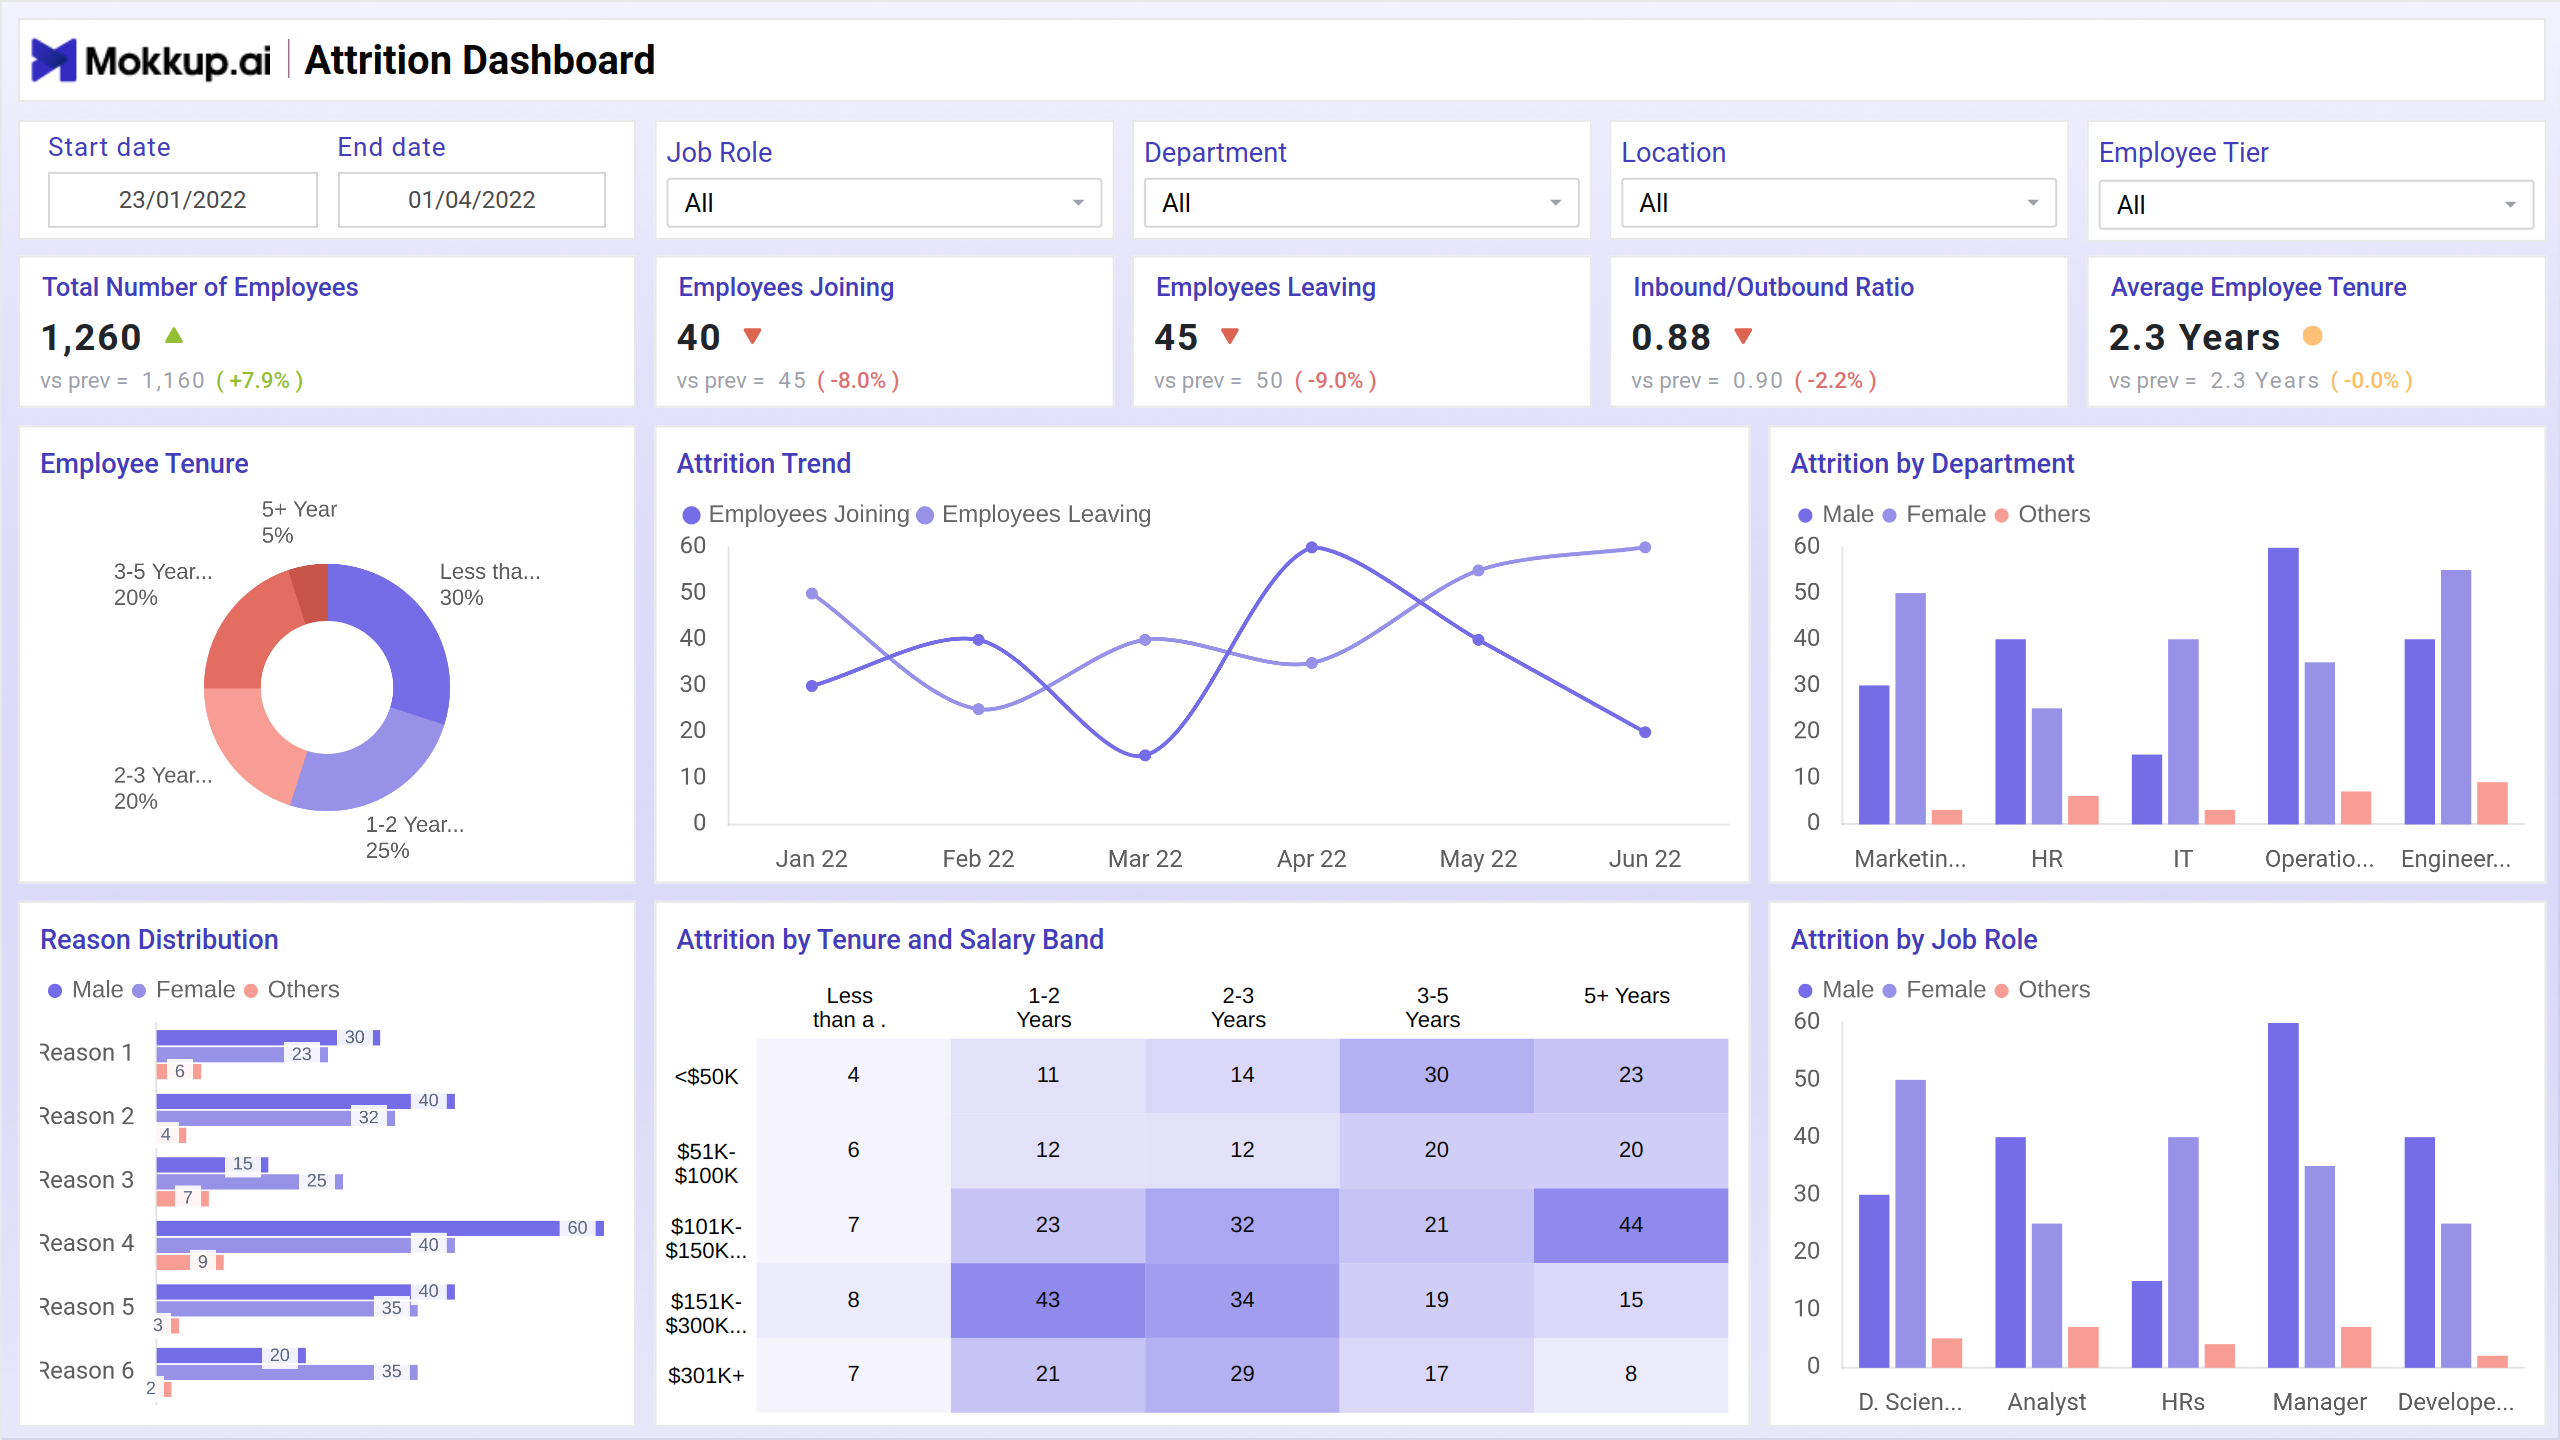
Build your own HR dashboard for attrition with a layout that organizes turnover data across roles, departments, and demographics. The Mokkup HR Attrition Dashboard template includes pre-built screens for Summary and Attrition Analysis. With clear visuals, it highlights key indicators like voluntary vs. involuntary attrition, tenure, and employee exit reasons. Once your data is added, export the wireframe to Power BI or Tableau for deeper analysis.
How to Analyze Data in HR Attrition Dashboards
The attrition report dashboard allows users to analyze workforce trends with filters for job roles, departments, tenure, and reasons for leaving. You can spot patterns across age groups, identify roles with high turnover, and view historical trends. These insights support HR teams in crafting targeted retention efforts and long-term hiring plans.
The two main screens include:
- Summary: Highlights age, tenure, department, and job title for departing employees to understand attrition triggers.
- Attrition Analysis: Features charts and graphs to track voluntary/involuntary attrition, tenure distribution, and reasons for termination.
How to Create an HR Attrition Dashboard
You don’t need to build your sample HR attrition dashboard from scratch. Use Mokkup’s HR Attrition Dashboard template to get started quickly. Here’s how:
1. Create or Log in to Your Mokkup Account
Sign up at Mokkup.ai with your email, or log in if you already have an account.
2. Choose and Customize Your HR Attrition Dashboard
Navigate to the Templates section, select the HR analytics attrition dashboard, and use the drag-and-drop editor to modify elements, apply filters, and add new metrics.
3. Export to Your BI Tool
After adding your data, export your dashboard to Power BI or Tableau. You can also download it as a PDF or image, embed it in reports, or share it with your team.
Note: This is a Pro template. To use and customize this dashboard, you’ll need a Pro subscription on Mokkup. Upgrade anytime to unlock full access.
Benefits of HR Attrition Dashboards
An HR Attrition Dashboard makes it easier for teams to visualize turnover patterns and plan effectively. With a centralized view of employee exits, it helps:
- Identify departments and roles with high attrition
- Analyze root causes of turnover
- Improve retention strategies with data-backed insights
- Monitor workforce stability and engagement levels
This makes it the best HR attrition dashboard for data-driven HR decision-making.
KPIs to Track in HR Attrition Dashboards
An HR attrition dashboard offers a structured way to monitor employee turnover. HR teams can address potential issues early by comparing these metrics across roles and departments. Key KPIs include:
- Attrition Rate: Total percentage of employees who left during a specific period.
- Inbound/Outbound Ratio: Compares new hires to exits for workforce stability.
- Average Employee Tenure: Measures how long employees stay on average.
- Voluntary vs. Involuntary Attrition: Tracks exit types for better context.
- Attrition by Department/Job Role: Identifies where turnover is most common.
- Reason for Termination: Breaks down the primary causes for leaving.
Frequently Asked Questions
Q1. How to calculate employee attrition rate accurately?
Divide the number of employees who left during a specific period by the average number of employees, then multiply by 100 to get the percentage.
Q2. What metrics should be included in attrition dashboards?
Key metrics include attrition rate, voluntary vs. involuntary exits, average tenure, department/role-based attrition, reasons for termination, and inbound/outbound ratio.
Q3. How to identify patterns in employee turnover data?
Use filters for role, department, tenure, and demographics. Visualizations like trend graphs and heatmaps help reveal high-risk groups and time-based patterns.
Q4. Best practices for reducing employee attrition rates?
Focus on employee engagement, competitive compensation, career development opportunities, and regular feedback to address retention risks early.
Q5. What are the key indicators of workforce retention issues?
High voluntary attrition, short average tenure, rising no-show or disengagement trends, and repeated exits in specific roles or departments signal retention problems.