
What is a Heart Vitality Dashboard?
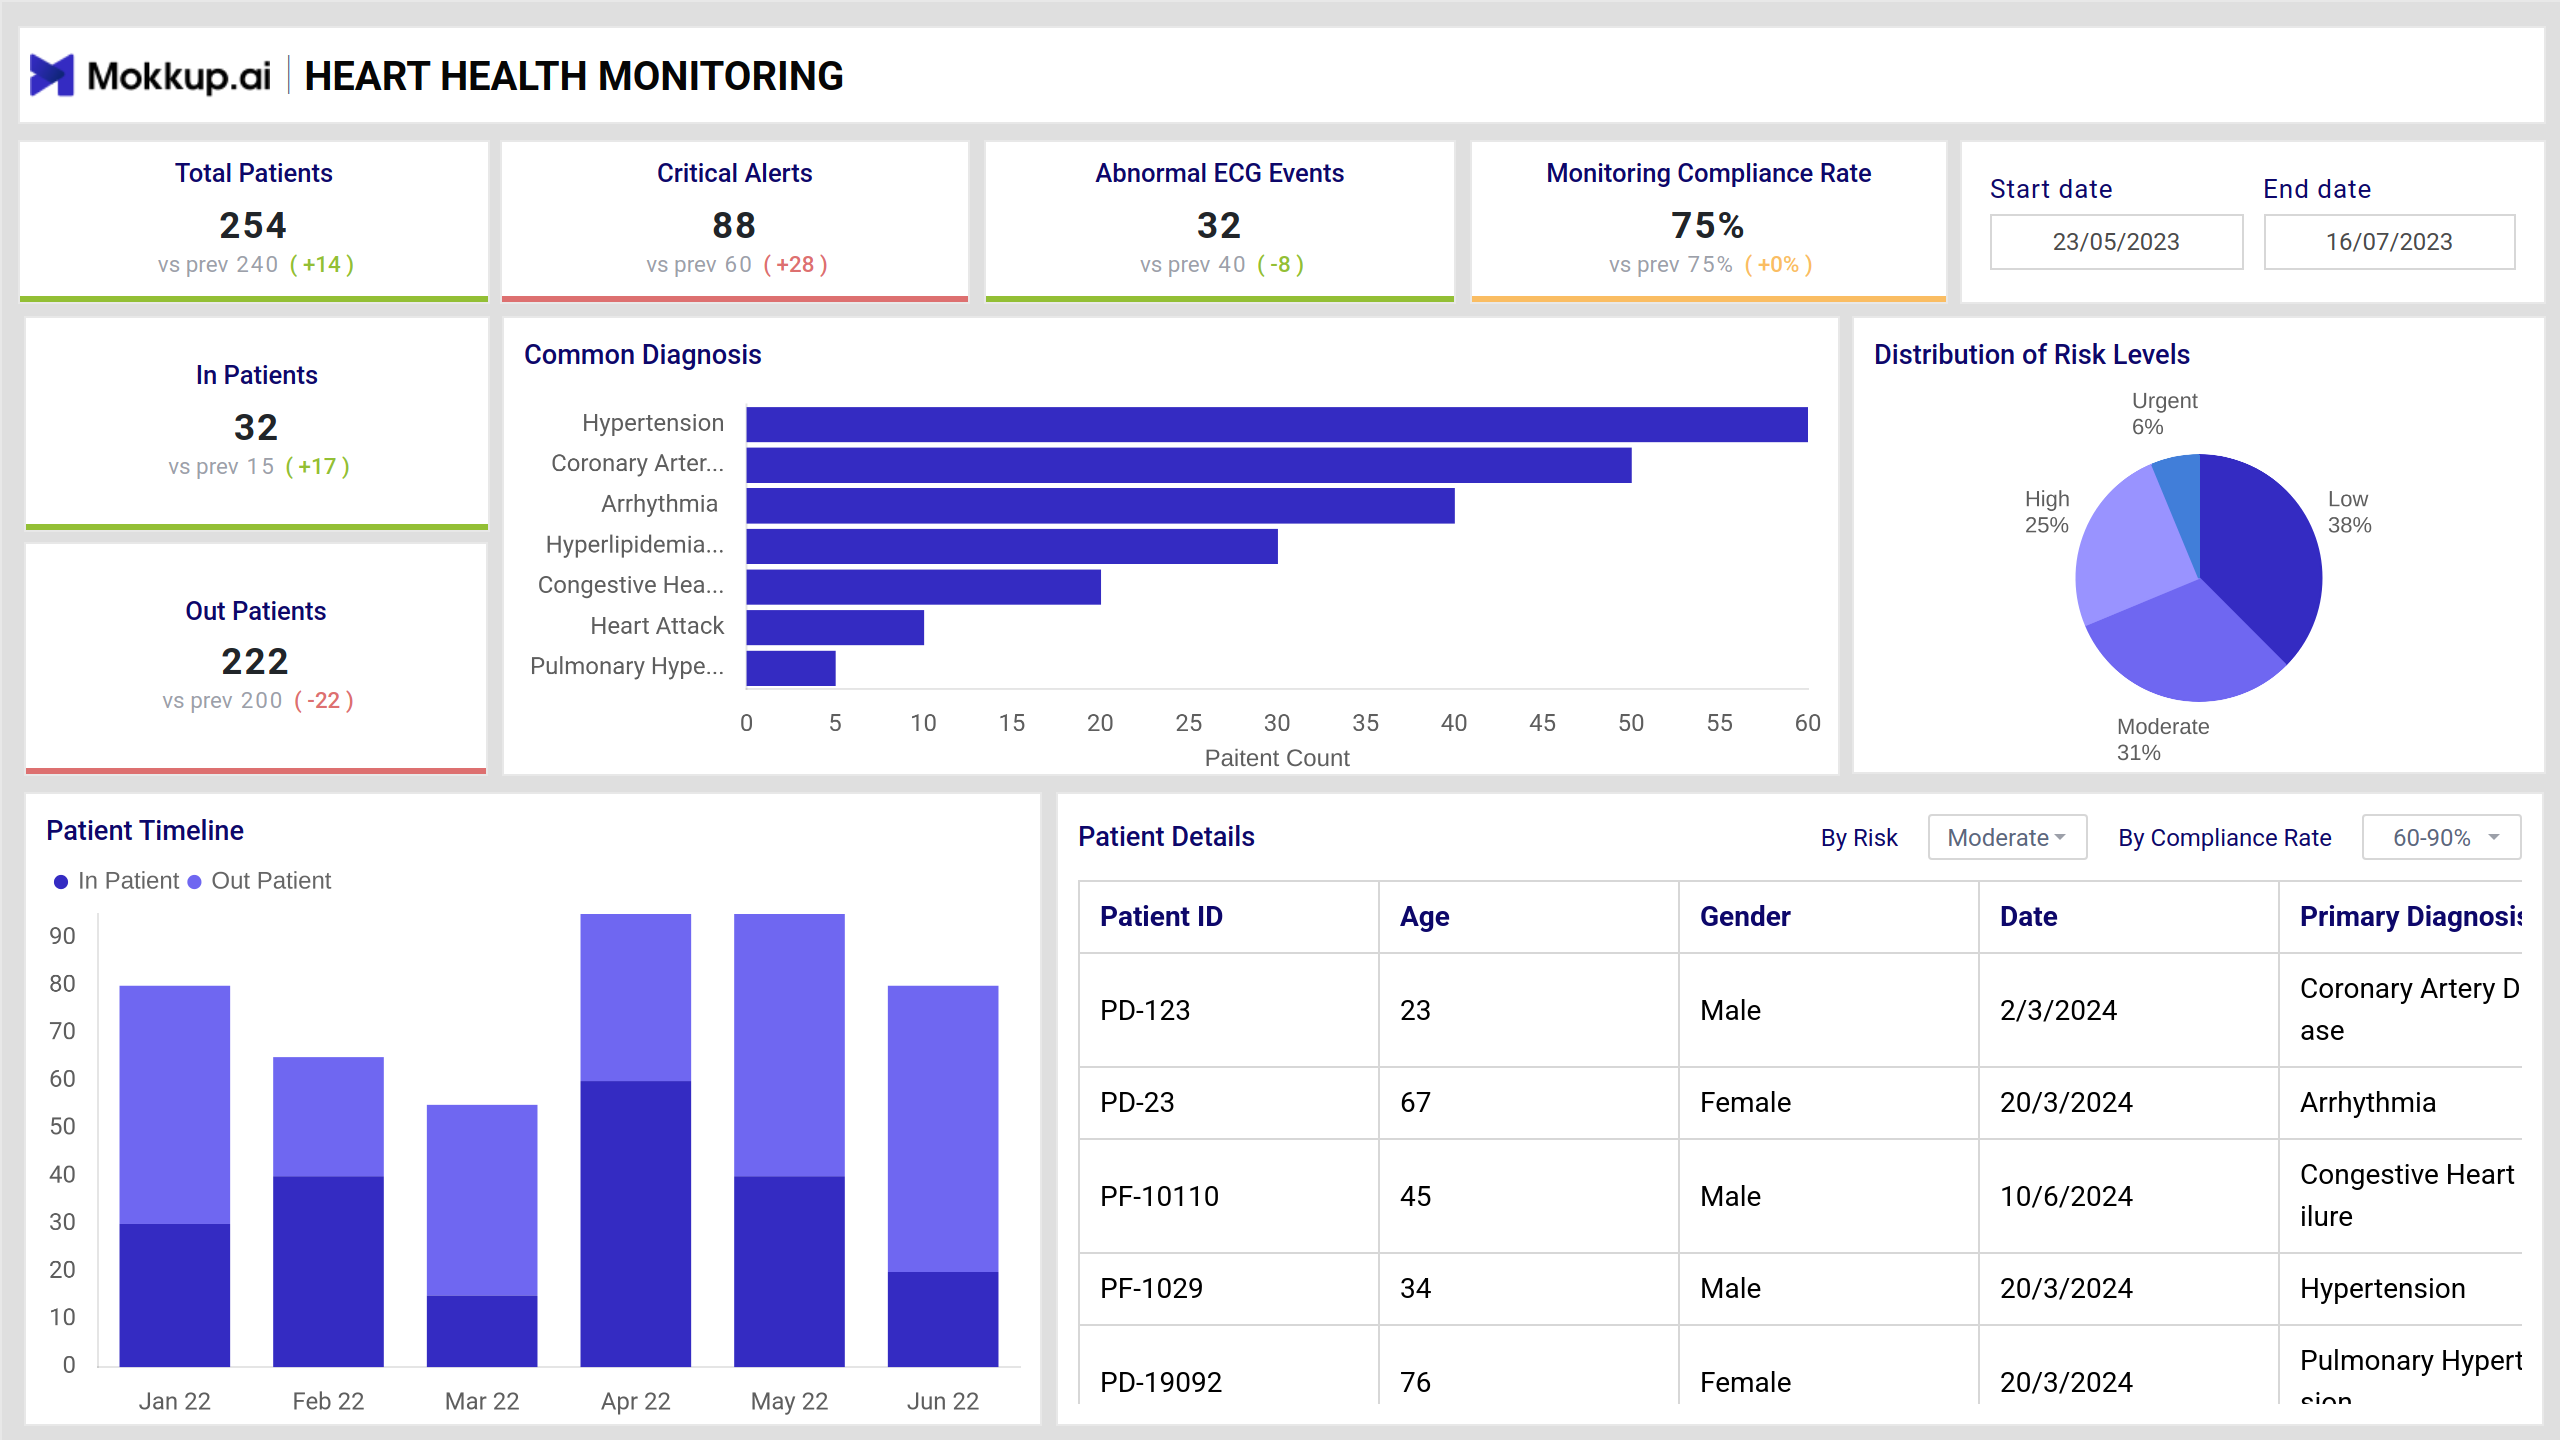
The Heart Vitality Dashboard template provides a comprehensive overview of patient health and clinic performance metrics for cardiology clinics. It facilitates monitoring, diagnosis, and treatment planning by presenting actionable insights through intuitive visualizations. The dashboard wireframe includes two primary screens: the Clinic Overview and the Patient Overview, offering a macro and micro perspective of heart health.
Heart Health Dashboard Example
The Heart Health Dashboard offers a comprehensive, data-driven view of cardiovascular wellness by tracking key indicators like heart rate, blood pressure, and cholesterol levels. It is designed for healthcare professionals, patients, and wellness coaches to monitor heart health trends and identify early signs of risk or improvement.
How to Analyze Data in Heart Health Dashboards
The cardiac health analytics dashboard template helps cardiology teams monitor clinic-wide trends, patient-level indicators, risk stratification, and treatment compliance. This wireframe supports proactive healthcare decisions and optimized patient outcomes. Here's how to analyze it:
- Using summary cards, track clinic KPIs like total patients, critical alerts, and abnormal ECGs. These help prioritize urgent cases and monitor population health at a glance.
- Use visuals like bar charts and risk-level pie charts to understand diagnosis frequency and patient distribution by risk category, helping clinics align resources to high-need areas.
- Drill into patient-level data with filters and tables, review patient vitals, compliance rates, and critical events to personalize treatment strategies.
- Analyze heart rate, activity levels, glucose, and cholesterol trends through interactive graphs. This enables healthcare professionals to detect irregularities and correlate them with lifestyle metrics.
The dashboard wireframe helps cardiology teams to combine clinical data and patient history into one intuitive view, helping them take action faster, plan better, and deliver more personalized cardiac care.
How to Create a Cardiac Health Dashboard
You don’t need to build your report from scratch—just start with a ready-to-use sample Heart Vitality Dashboard template from Mokkup. Add in your data and export it however you like. Here’s how to do it:
1. Create or Log in to Your Mokkup Account
Start by signing up on Mokkup.ai using your email. Already have an account? Just log in, and you’re good to go.
2. Choose and Customize Your Dashboard Template
Find the Heart Vitality Dashboard in the Templates section. Use the drag-and-drop editor to adjust KPIs, edit filters, or add elements based on your data.
3. Export to Your BI Tool
Once your dashboard wireframe is ready, use the BI Tool Export feature to send it directly to Power BI or Tableau for further analysis and enhancements. You can also download the dashboard as a PDF, PNG, or JPEG, embed it on a platform, or invite your team to collaborate.
Note: This is a Pro template. To use and customize this dashboard wireframe, you’ll need a Pro subscription on Mokkup. Upgrade anytime to unlock full access.
Benefits of Heart Vitality Dashboards
Heart vitality dashboards are essential in modern cardiology settings, helping clinicians monitor key metrics, detect early warning signs, and ensure proactive care. With real-time insights and historical trends, they transform complex patient data into clear, actionable decisions.
Key Benefits:
- Early Risk Detection: The dashboard enables early identification of cardiac anomalies by continuously tracking vital signs like blood pressure, heart rate, and ECG readings.
- Improved Treatment Compliance: Monitoring adherence metrics helps doctors intervene when patients stray from prescribed routines, ensuring better long-term outcomes.
- Streamlined Decision-Making: Centralized visualizations simplify clinical workflows, allowing faster, evidence-based decisions across large patient populations.
- Enhanced Patient Engagement: Providing patients with clear visuals of their heart health encourages active participation in their care journey.
- Efficient Resource Allocation: Identifying critical cases quickly allows clinics to focus attention and resources where they are needed most.
By offering both macro and micro views of patient health, heart vitality dashboards improve efficiency, accuracy, and patient outcomes, turning real-time data into better cardiac care.
KPIs to Track in Cardiac Dashboards
Cardiac dashboards rely on key performance indicators (KPIs) to help healthcare professionals monitor patient well-being, clinic efficiency, and response readiness. Here are four crucial metrics to track:
- Total Patients: Indicates how many individuals are currently under heart health monitoring. Comparing this number with previous periods helps assess patient volume trends and service reach.
- Critical Alerts: This displays the number of patients with urgent health issues flagged by the system. This helps prioritize care for high-risk individuals.
- Abnormal ECG Events: Captures irregular ECG readings that could point to potential cardiac complications, enabling timely diagnosis and intervention.
- Monitoring Compliance Rate: This rate reflects how regularly patients follow their prescribed monitoring schedules, offering insights into patient engagement and areas needing attention.
These KPIs provide a clear and actionable snapshot of clinical operations and patient health status in cardiology care.
Frequently Asked Questions
Q1. What is a cardiac dashboard used for?
A cardiac dashboard visually tracks key patient metrics, such as ECG events, blood pressure, and critical alerts. It helps clinics monitor heart health, improve treatment planning, and respond faster to emergencies.
Q2. How often is patient data updated in the dashboard?
Data is typically updated in real-time or at regular intervals (e.g., every 15 minutes or hourly), depending on the connected devices and hospital systems.
Q3. Can the dashboard be customized for different patient risk levels?
Yes, filters can be applied to view patients by risk category (e.g., low, moderate, high, urgent), helping practitioners prioritize care and focus on those needing immediate attention.