
What is a Heart Center Cath Lab Utilization Dashboard?
A Heart Center Cath Lab Utilization Dashboard is a healthcare analytics tool designed to provide real-time insights into procedure volumes, lab utilization, emergency vs elective cases, procedure accuracy, and operational efficiency. By centralizing these key metrics, the dashboard enables cardiology departments, hospital administrators, and investors to monitor lab performance, identify bottlenecks, and optimize resource allocation, thereby maximizing throughput and enhancing patient care quality.
How to Create a Heart Center Cath Lab Utilization Dashboard
You don’t need to start from scratch — use a ready-to-use dashboard template from Mokkup and add your hospital data.
Steps:
1. Create or Log in to Your Mokkup Account
Sign up at Mokkup.ai using your email. If you already have an account, log in to get started.
2. Choose and Customize Your Dashboard Template
Select the Heart Center Cath Lab Utilization template under “Healthcare.” Customize KPIs, visuals, and filters to match your hospital’s labs, procedure types, cardiologists, and patient segments.
3. Export to Your BI Tool
Once your dashboard is ready, export it to Power BI or Tableau for detailed analysis. You can also download it as a PDF, PNG, or JPEG, embed it in presentations, or share it with stakeholders.
Note: This is a Pro template. To unlock all features, upgrade to a Pro subscription on Mokkup.
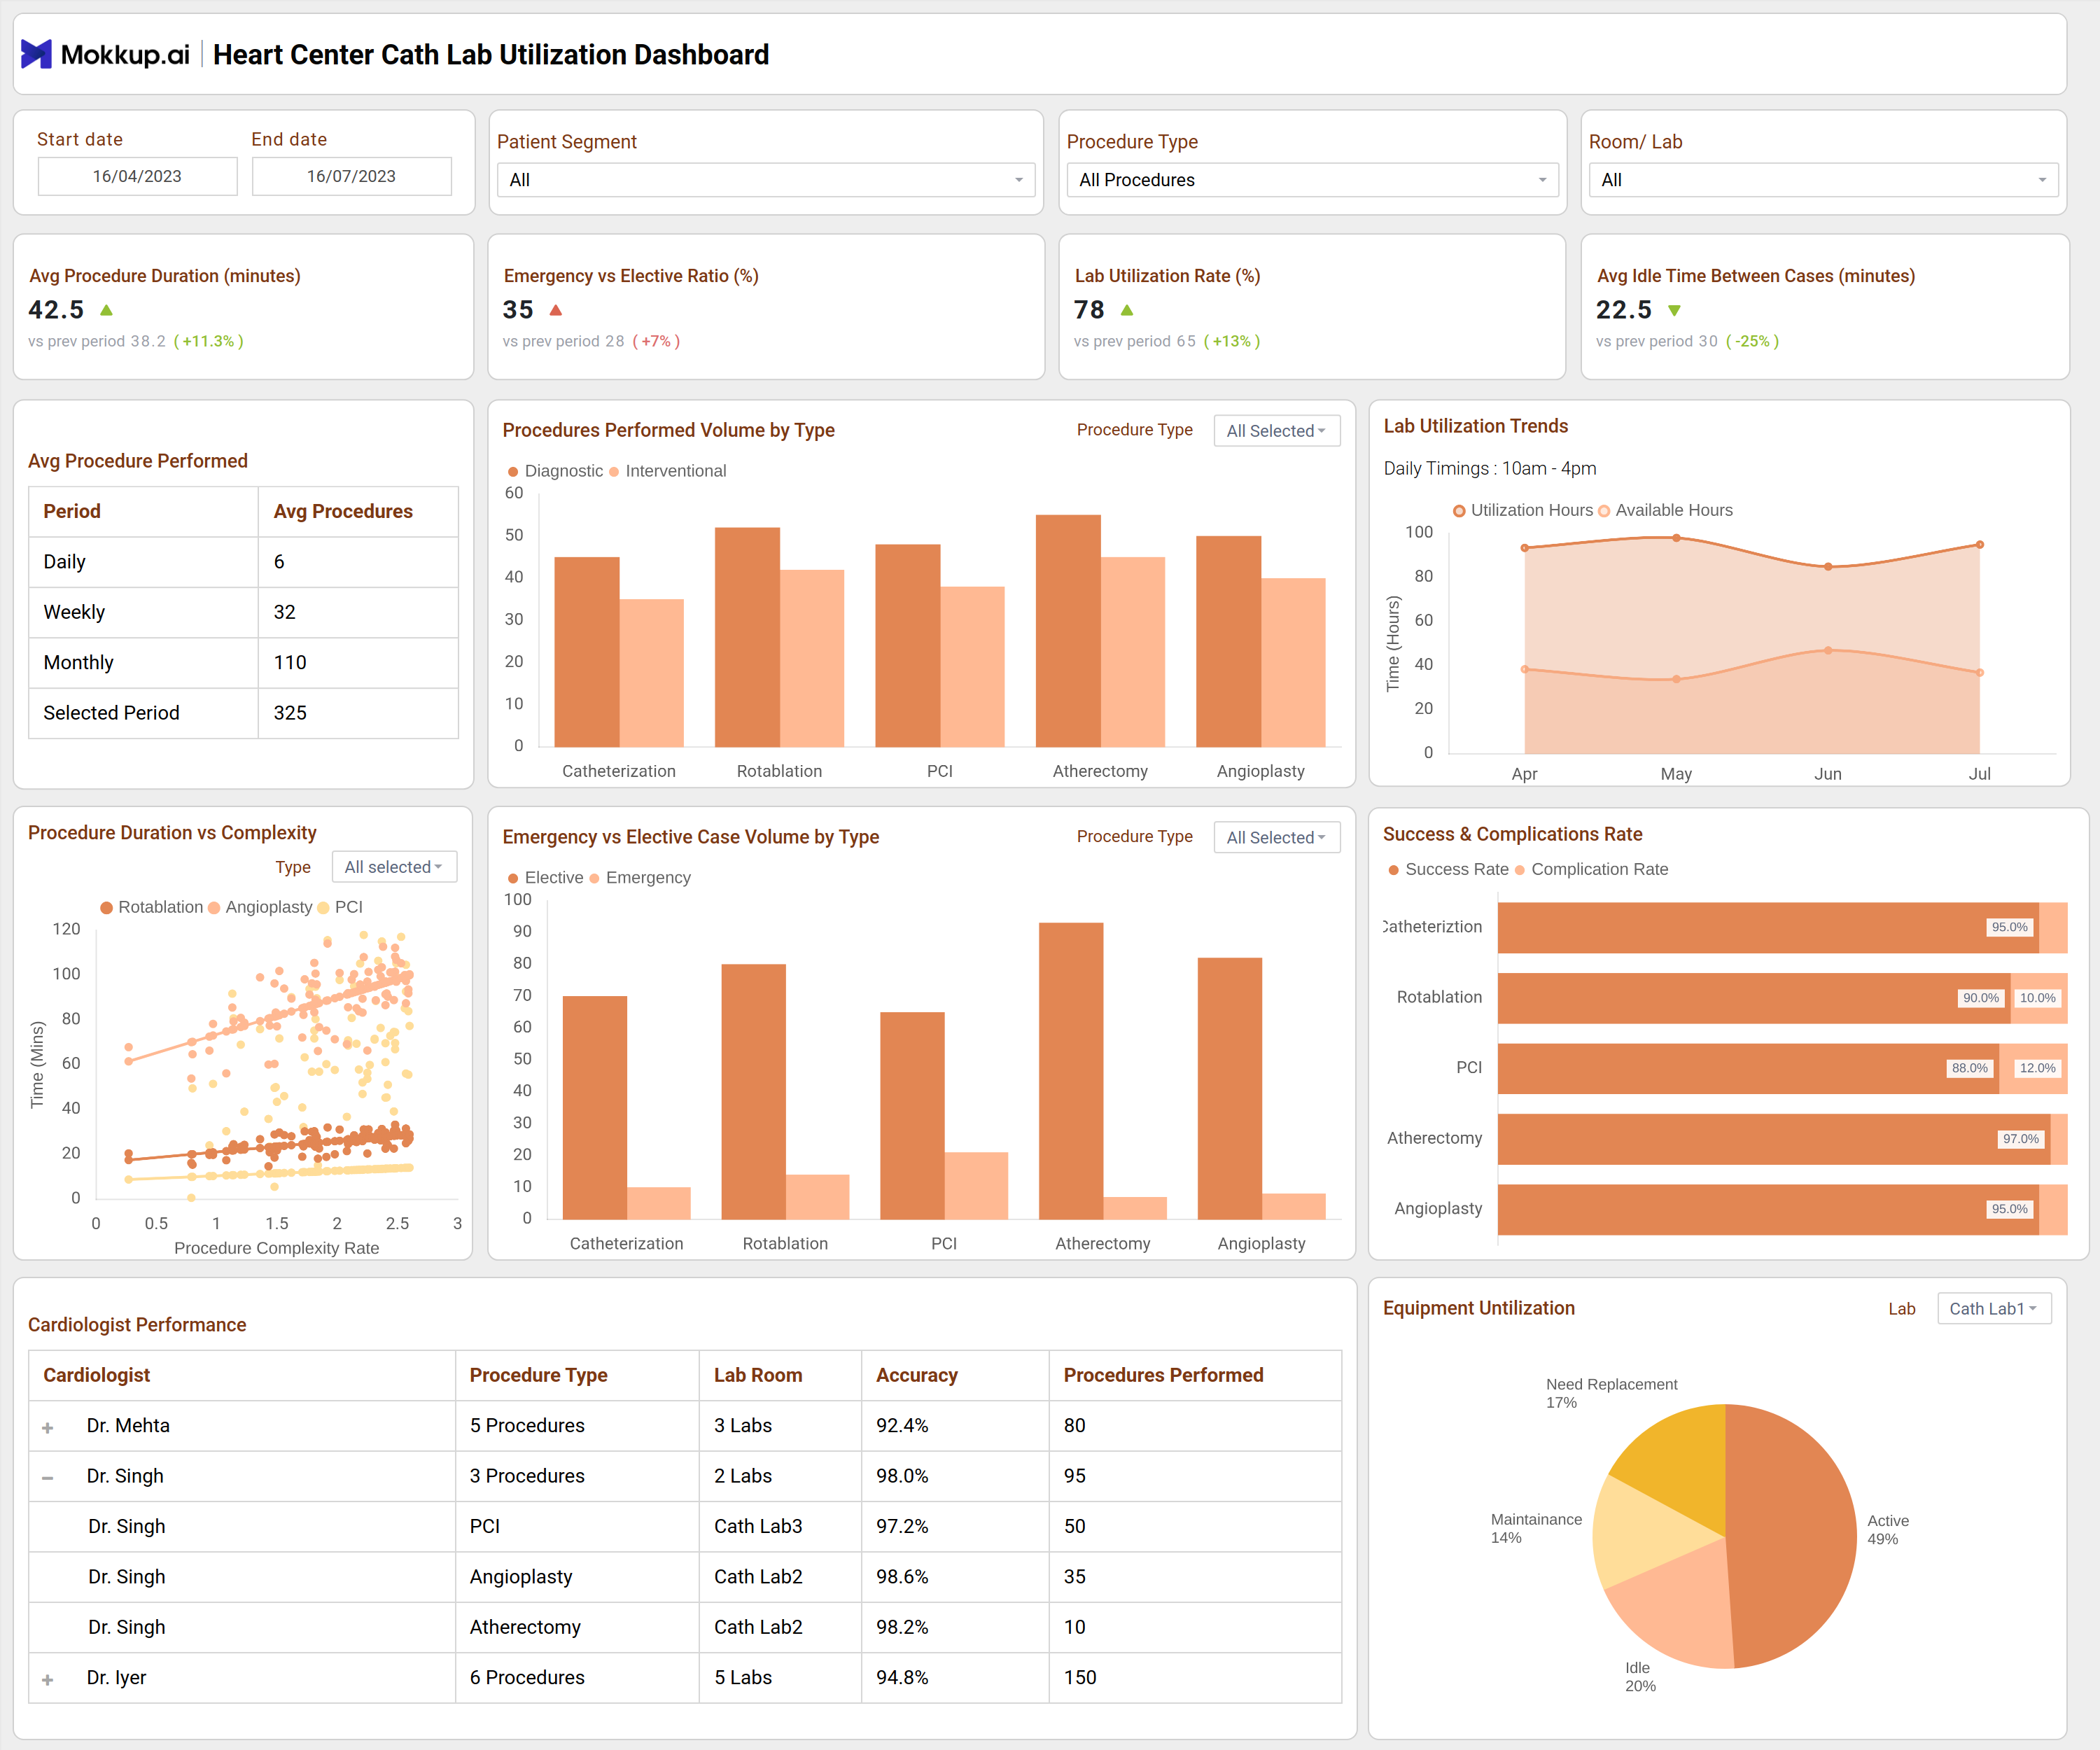
Heart Center Cath Lab Utilization Dashboard Example
The dashboard provides a comprehensive view of Cath Lab operations across three key areas:
- Tracks total procedures performed (daily, weekly, monthly) to monitor lab throughput.
- Shows procedures performed by type (diagnostic, PCI, stent, angioplasty, atherectomy) and elective vs emergency distribution.
- Visualizes lab utilization trends by comparing actual hours used vs available hours.
- Highlights procedure accuracy and volume per cardiologist, procedure type, and lab room using hierarchy charts.
- Compares procedure duration vs patient complexity to evaluate efficiency.
- Monitors success and complication rates by procedure type for quality assurance.
How to Analyze Data in Cath Lab Dashboards
Organizations can use this dashboard to:
- Monitor Procedure Volumes: Track daily, weekly, and monthly throughput by procedure type.
- Evaluate Lab Utilization: Understand how efficiently lab resources are being used and identify idle capacity.
- Assess Procedure Quality: Analyze success, complication rates, and accuracy to improve outcomes and training.
- Compare Cardiologist Performance: Drill down by operator, procedure type, and lab to identify bottlenecks or expertise gaps.
- Optimize Operational Efficiency: Adjust scheduling, resource allocation, and lab workflow for maximum productivity.
Benefits of Heart Center Cath Lab Utilization Dashboards
- Improved Operational Efficiency: Monitors lab usage, idle time, and procedure scheduling.
- Enhanced Quality Insights: Tracks procedure success, complication rates, and accuracy per operator.
- Data-Driven Decisions: Enables administrators and stakeholders to make informed choices based on real metrics.
- Resource Optimization: Highlights lab and cardiologist performance to allocate rooms and staff effectively.
- Stakeholder Confidence: Transparent reporting for executives, lab managers, and investors.
KPIs to Track in Heart Center Cath Lab Dashboards
- Total Procedures Performed (Daily / Weekly / Monthly): Tracks lab throughput trends.
- Average Procedure Duration: Measures the mean time taken per procedure.
- Emergency vs Elective Case Ratio: Proportion of urgent vs scheduled cases.
- Lab Utilization Rate (%): Percentage of lab hours used vs available.
- Average Idle Time Between Cases: Evaluates efficiency of scheduling and prep.
- Procedure Accuracy by Cardiologist / Lab / Procedure Type: Tracks the correctness and precision of procedures.
- Success & Complication Rate by Procedure Type: Monitors quality outcomes per procedure type.
Frequently Asked Questions
Q1. Why is a Cath Lab Utilization Dashboard important for heart centers?
It provides real-time visibility into procedure volumes, lab efficiency, and operational quality, enabling better decision-making and improved patient care.
Q2. Which types of hospitals benefit most from this dashboard?
Heart centers, cardiac hospitals, multi-specialty hospitals with cardiology services, and institutions focused on procedural efficiency.