
- Automated Cost Tracking: Reduces manual effort by automating benefits and claims cost-monitoring.
- Improved Cost Control: Identifies high claims plans and key cost drivers early.
- Data-Driven Decisions: Enhances decision-making using clear performance metrics.
- Optimized Plan Selection: Supports better plan comparison using enrollment and claims insights.
- Regulatory Compliance: Helps ensure adherence to reporting and compliance requirements.
- Employee Satisfaction: Aligns benefits offerings with workforce needs and preferences.
- Strategic Budget Planning: Supports renewal planning and long-term budget forecasting.
What is a Health Insurance Employee Benefits Plan Review Dashboard?
A Health Insurance Employee Benefits Plan Review Dashboard template is a centralized analytics tool that helps HR teams, benefits administrators, and business leaders track, analyze, and optimize group health insurance plans. It consolidates key metrics such as total benefits cost, claims expenses, employer contributions, enrollment rates, and cost as a percentage of payroll into a single, interactive interface. By providing data-driven insights, this dashboard enables organizations to assess plan performance, identify cost-saving opportunities, and ensure compliance with regulatory requirements.
Unlike manual spreadsheets or fragmented reports, a benefits plan review dashboard automates data aggregation, allowing users to filter by plan type, age range, department, and location for deeper analysis. This structured approach helps businesses make informed decisions about plan renewals, employee contributions, and coverage adjustments, ultimately improving benefits administration efficiency.
How to Create a Health Insurance Employee Benefits Plan Review Dashboard
You don’t need to build your report from scratch, just start with a ready-to-use Health Insurance Employee Benefits Plan Review dashboard template from Mokkup. Add in your data and export it however you like. Here’s how to do it:
1. Create or Log in to Your Mokkup Account
Start by signing up on Mokkup.ai using your email. If you already have an account, just log in, and you’ll be good to go.
2. Choose and Customize Your Dashboard Template
Find the Health Insurance Employee Benefits Plan Review Dashboard template in the Templates section. Use the drag and drop editor to adjust KPIs, edit filters, or add elements based on your data.
3. Export to Your BI Tool
Once your dashboard wireframe is ready, use the BI Tool Export feature to send it directly to Power BI or Tableau for further analysis and enhancements. You can also download the dashboard as a PDF, PNG, or JPEG, embed it on a platform, or invite your team to collaborate.
Note: This is a Pro template. You’ll need a Pro subscription on Mokkup to use and customize this dashboard wireframe. Upgrade anytime to unlock full access.
Health Insurance Employee Benefits Plan Review Dashboard Example
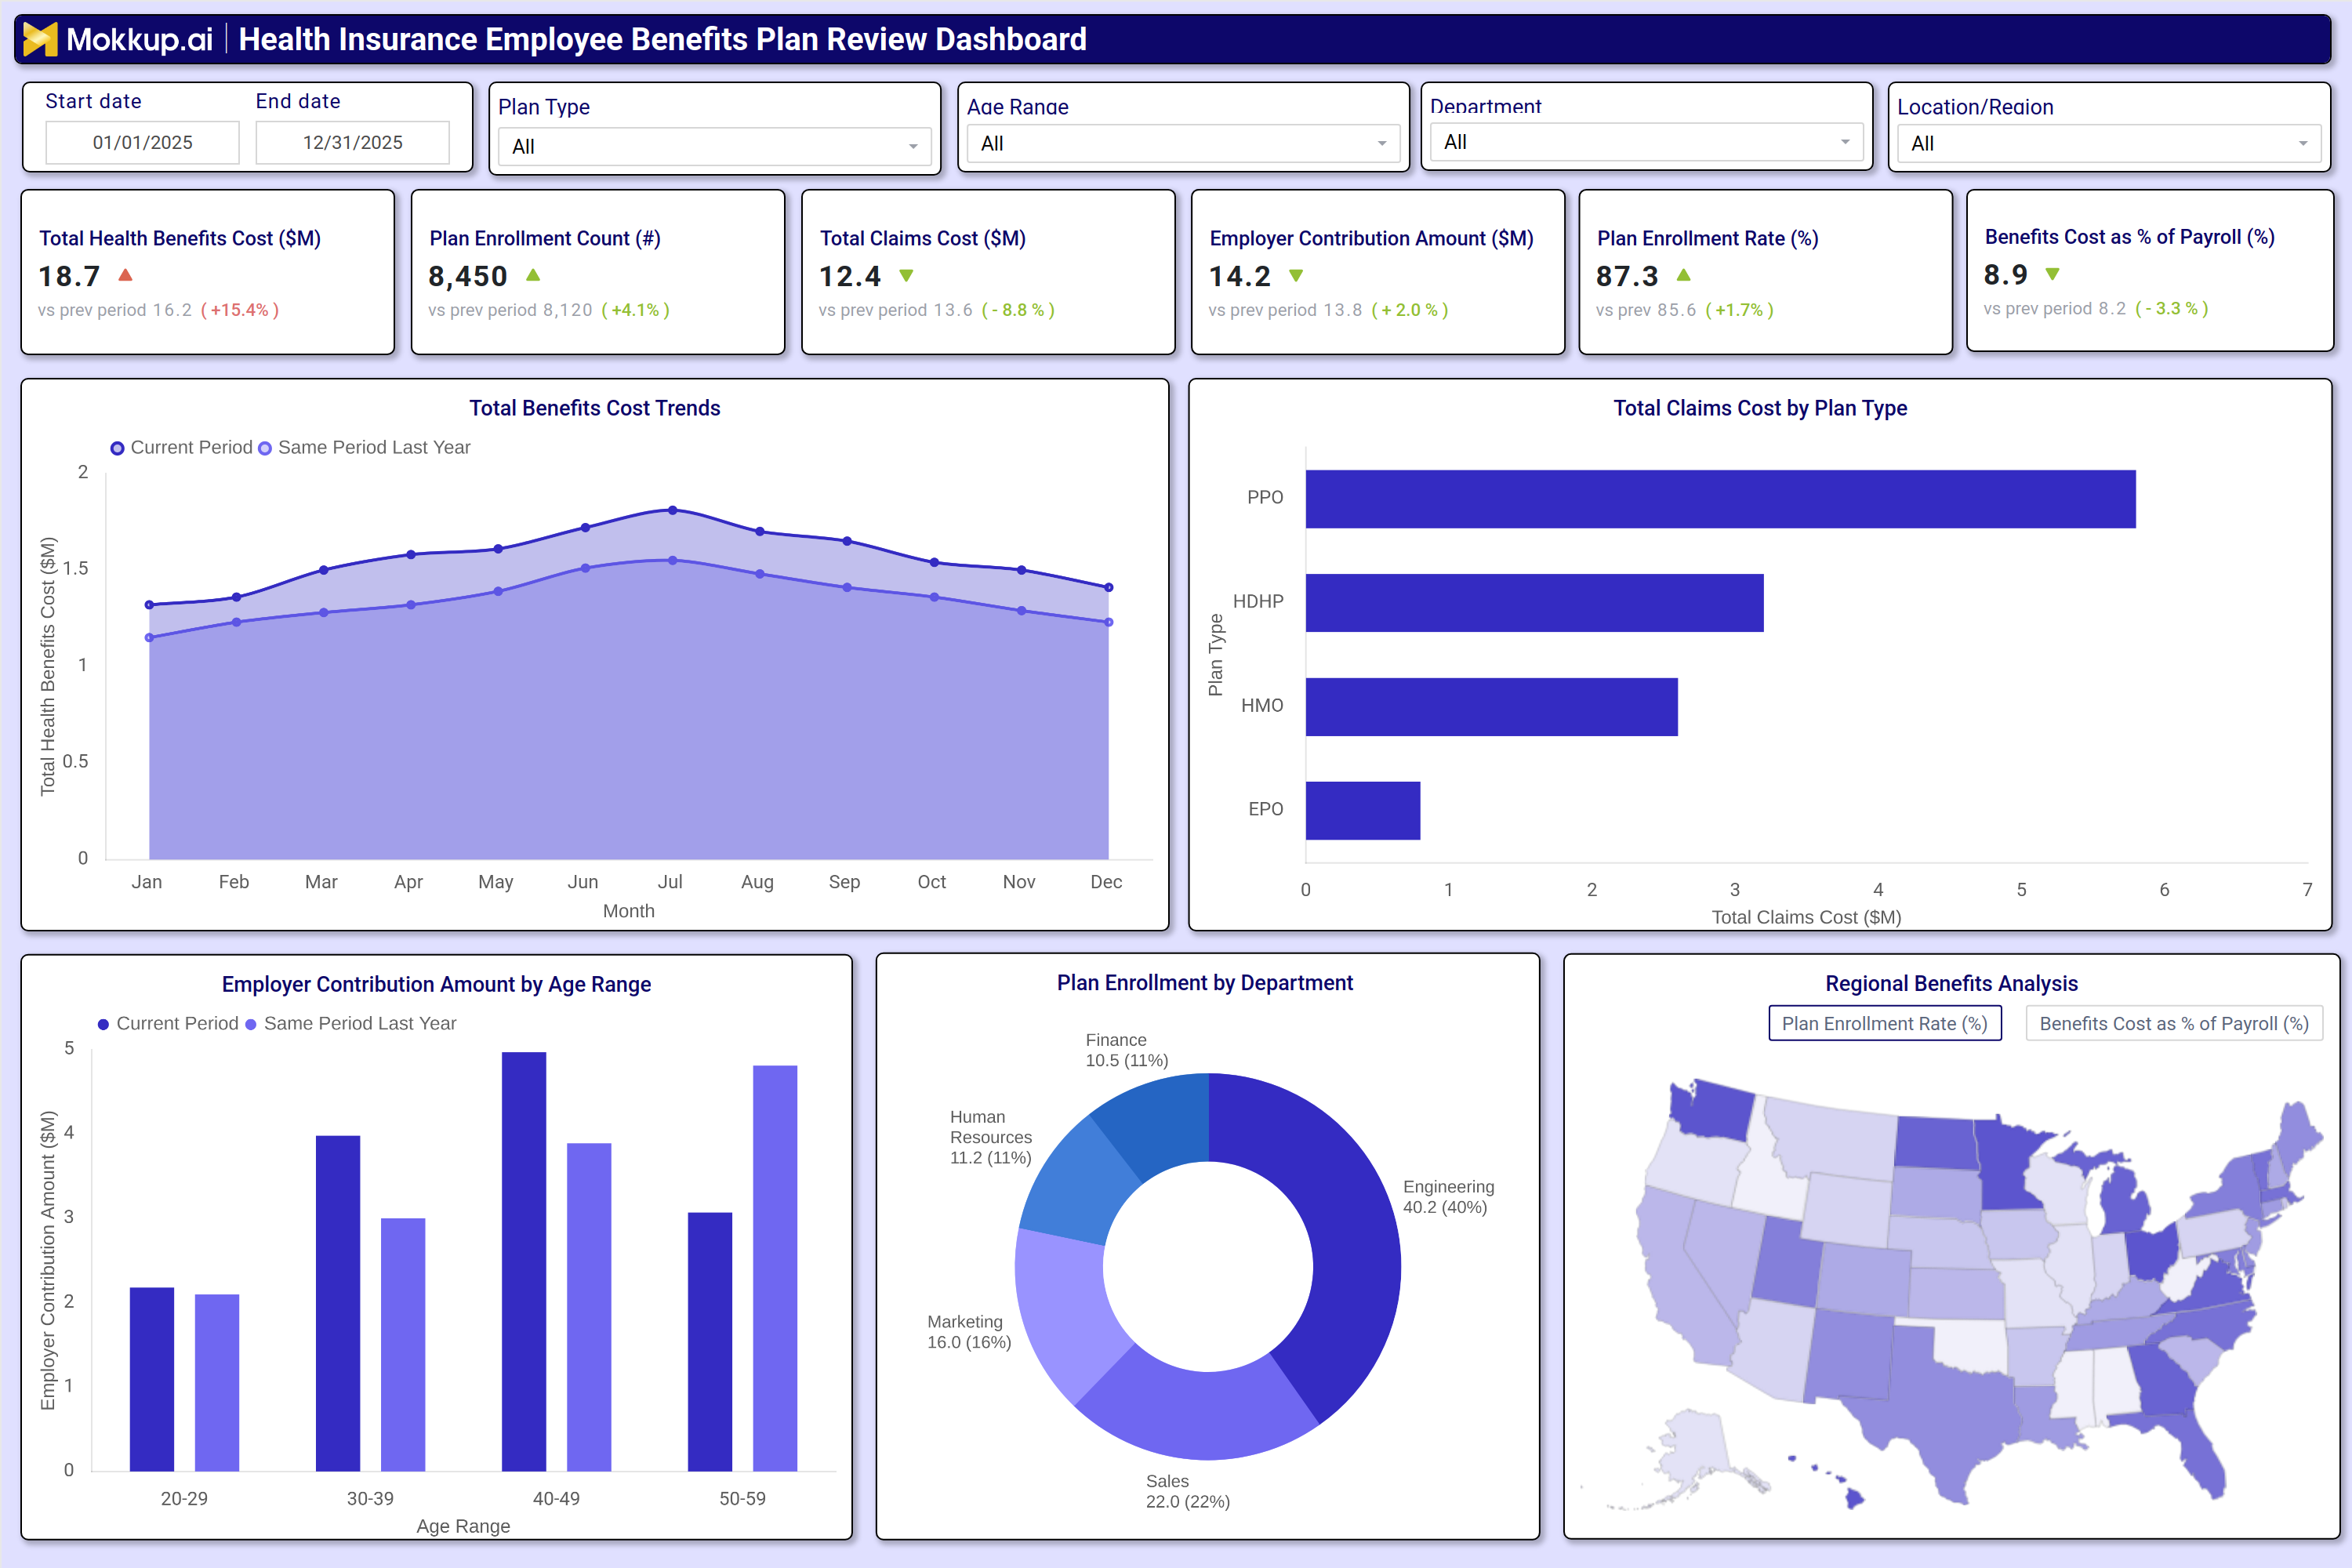
A well-designed cost containment strategies for health insurance dashboard includes interactive filters, performance tiles, trend charts, and geographic breakdowns to provide a comprehensive view of health insurance costs and utilization. For example, the dashboard may display, Total health benefits cost (with year over year comparisons), Plan enrollment count (showing growth or decline in participation), Total claims cost (highlighting high expense areas), Employer contribution amounts (to assess cost sharing strategies), Enrollment rates by department and age group (to identify adoption trends), Benefits cost as a percentage of payroll (to evaluate affordability).
Visual elements like bar charts (claims by plan type), line graphs (cost trends), and heatmaps (regional benefits analysis) help stakeholders quickly identify patterns. For instance, if PPO plans show significantly higher claims costs than HDHPs, HR teams can explore cost-control measures such as employee education on high-deductible plans or adjusting employer contributions.
How to Analyze Data in a Health Insurance Employee Benefits Plan Review Dashboard
Here is how you can analyze data from this dashboard:
- Cost Trend Analysis: Compare total benefits cost trends with previous periods to identify increases or unusual spikes.
- Plan Cost Comparison: Review claims costs by plan type such as PPO, HDHP, HMO, and EPO to detect high expense plans.
- Enrollment Participation: Assess enrollment rates by department to identify teams with low benefits participation.
- Employer Contribution Review: Evaluate employer contribution amounts to ensure cost sharing aligns with budget targets.
- Cost to Payroll Ratio: Analyze benefits cost as a percentage of payroll to maintain financial sustainability.
- Regional Cost Variation: Examine regional differences in enrollment and claims costs to optimize location based benefits.
- Age-Based Contribution Monitoring: Monitor age based employer contributions to ensure fairness and compliance.
- Enrollment Growth Tracking: Track plan enrollment growth to measure the effectiveness of benefits communication strategies.
Benefits of a Health Insurance Employee Benefits Plan Review Dashboard
The following are the benefits of using this dashboard:
KPIs to Track in a Health Insurance Employee Benefits Plan Review Dashboard
The following key KPIs can be tracked by using this HR benefits analytics dashboard:
- Total Health Benefits Cost ($M): Measures the overall cost of providing health insurance to employees.
- Plan Enrollment Count (#): Tracks the number of employees enrolled in each benefits plan.
- Total Claims Cost ($M): Indicates the total amount spent on employee health claims.
- Employer Contribution Amount ($M): Shows how much the company contributes toward premiums.
- Plan Enrollment Rate (%): Measures the percentage of eligible employees enrolled in benefits.
- Benefits Cost as % of Payroll (%): Evaluates affordability by comparing benefits costs to total payroll.
Frequently Asked Questions
Q1. What is an employee health benefits cost tracking dashboard?
A benefits plan review dashboard is an analytics tool that helps businesses track and optimize group health insurance costs, enrollment, and claims data.
Q2. How does employee benefits administration software help with cost savings?
It identifies high-cost plans, claims trends, and enrollment gaps, allowing HR teams to adjust contributions and coverage for better financial control.
Q3. Who should use a group health plan management dashboard?
HR managers, benefits administrators, CFOs, and business leaders responsible for group health plan management and employee benefits optimization.