
What is a Geothermal Power Plant Enhancement Monitoring Dashboard?
A Geothermal Power Plant Enhancement Monitoring Dashboard is a centralized analytics platform designed to track, analyze, and optimize the performance of Enhanced Geothermal Systems (EGS) during research, pilot testing, and early-stage deployment. It integrates subsurface, reservoir, injection, and seismic data to provide a real-time view of stimulation effectiveness, reservoir behavior, and operational risks. By combining geothermal reservoir monitoring system data with advanced visualization, the dashboard supports R&D teams in evaluating stimulation outcomes, well connectivity, injectivity improvements, and thermal performance. This enables data-driven decisions for improving reservoir design, reducing uncertainty, and accelerating EGS technology development.
How to Create a Geothermal Power Plant Enhancement Monitoring Dashboard
You don’t need to build your report from scratch, just start with a ready-to-use dashboard template from Mokkup. Add in your data and export it however you like. Here’s how to do it:
1. Create or Log in to Your Mokkup Account
Start by signing up on Mokkup.ai using your email. If you already have an account, just log in, and you’ll be good to go.
2. Choose and Customize Your Dashboard Template
Find the Geothermal Power Plant Enhancement Monitoring Dashboard template in the Templates section. Use the drag-and-drop editor to adjust KPIs, edit filters, or add elements based on your data.
3. Export to Your BI Tool
Once your dashboard wireframe is ready, use the BI Tool Export feature to send it directly to Power BI or Tableau for further analysis and enhancements. You can also download the dashboard as a PDF, PNG, or JPEG, embed it on a platform, or invite your team to collaborate.
Note: This is a Pro template. You’ll need a Pro subscription on Mokkup to use and customize this dashboard wireframe. Upgrade anytime to unlock full access.
Geothermal Power Plant Enhancement Monitoring Dashboard Example
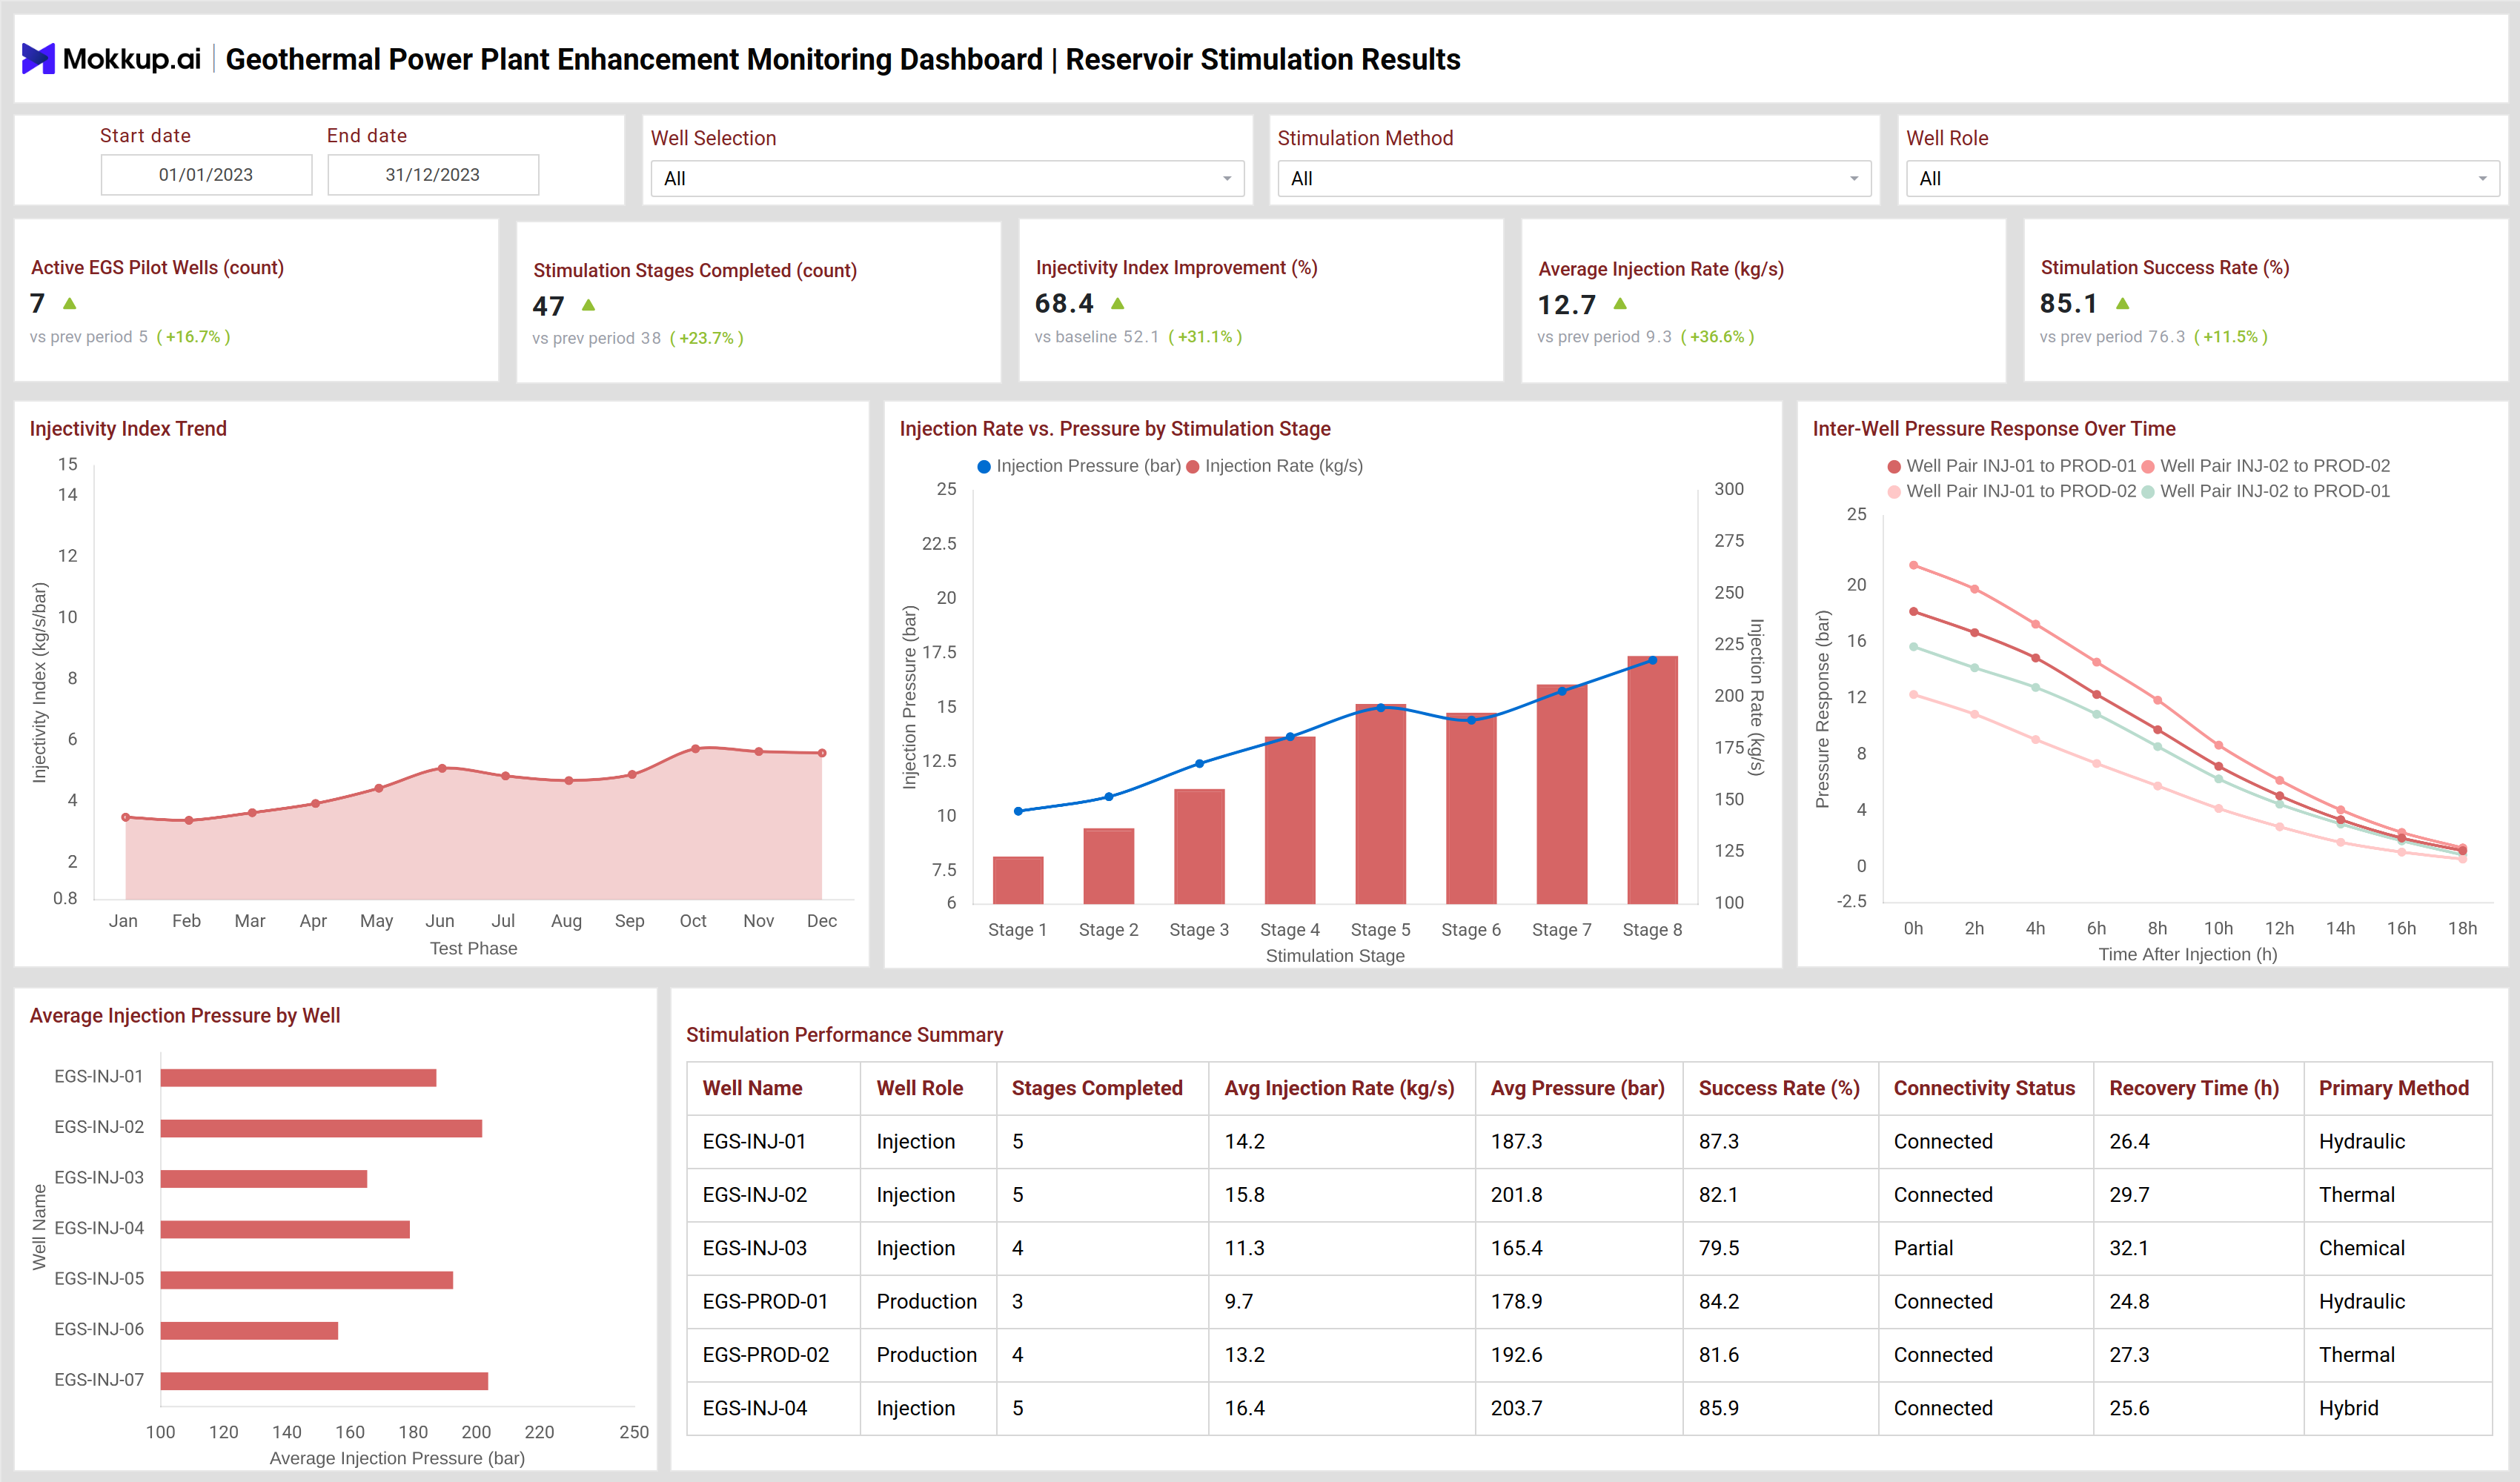
You can build an enhanced geothermal monitoring dashboard using the modules shown in the reference images to cover both reservoir stimulation performance and seismic risk assessment in a single interface. The dashboard typically opens with high-level KPIs such as active EGS pilot wells, stimulation stages completed, injectivity index improvement, average injection rate, and stimulation success rate. These indicators provide an immediate assessment of experimental progress and reservoir response. The stimulation performance view visualizes injectivity index trends, injection rate versus pressure by stimulation stage, and average injection pressure by well.
These charts help researchers evaluate how different stimulation methods influence reservoir permeability and fluid flow. Inter-well pressure response trends further support geothermal subsurface monitoring dashboard use cases by revealing hydraulic connectivity between injection and production wells. The seismic monitoring section focuses on microseismic events detected, maximum event magnitude, produced fluid temperature, and thermal drawdown rate. Event magnitude distributions and seismic safety compliance status help teams balance reservoir enhancement with induced seismicity risks. Together, these views form a robust enhanced geothermal plant system analytics environment for pilot-scale research and technology validation.
How to Analyze Geothermal Power Plant Enhancement Monitoring Dashboard
Here is how you can analyze data from this dashboard:
- Review active pilot well counts and stimulation stages to track R&D execution progress
- Analyze injectivity index trends to measure permeability improvements after stimulation
- Compare injection rate versus pressure across stages to evaluate stimulation efficiency
- Monitor inter-well pressure response to assess reservoir connectivity and fracture growth
- Track microseismic event frequency and magnitude to manage seismic risk thresholds
- Evaluate produced fluid temperature trends to identify early thermal drawdown risks
- Use power potential estimates to link reservoir performance with future generation viability
Benefits of Geothermal Power Plant Enhancement Monitoring Dashboard
The following are the benefits of using this enhanced geothermal system monitoring dashboard:
- Enables real-time visibility into EGS pilot performance and subsurface behavior
- Improves decision-making for stimulation design and operational adjustments
- Supports safe experimentation through integrated seismic monitoring and regulatory compliance tracking
- Accelerates R&D learning cycles using centralized geothermal reservoir monitoring system data
- Reduces uncertainty in reservoir modeling and performance forecasting
- Enhances collaboration between geoscience, engineering, and research teams
- Provides a scalable foundation for transitioning pilots into commercial EGS projects
KPIs to Track in Geothermal Power Plant Enhancement Monitoring Dashboard
The following key KPIs can be tracked by using this dashboard:
- Active EGS Pilot Wells – Tracks the number of wells currently under stimulation or monitoring
- Stimulation Stages Completed – Measures progress across planned stimulation phases
- Injectivity Index Improvement – Quantifies permeability enhancement achieved through stimulation
- Average Injection Rate – Indicates fluid delivery efficiency into the reservoir
- Stimulation Success Rate – Evaluates the effectiveness of applied stimulation methods
- Microseismic Events Detected – Monitors induced seismic activity linked to stimulation
- Maximum Event Magnitude – Assesses seismic risk against regulatory and safety thresholds
- Produced Fluid Temperature – Tracks reservoir thermal output and heat recovery potential
- Thermal Drawdown Rate – Measures long-term sustainability of heat extraction
- Estimated Pilot Power Potential – Links reservoir performance to future energy output
Frequently Asked Questions
1. What is the purpose of an Geothermal Power Plant Enhancement Monitoring Dashboard ?
It supports R&D teams by providing real-time insights into reservoir stimulation, seismic response, and thermal performance for Enhanced Geothermal Systems.
2. How does this dashboard support geothermal research and development?
It enables controlled experimentation, performance tracking, and risk management using integrated enhanced geothermal system analytics.
3. Can this dashboard help manage induced seismicity risks?
Yes, it includes microseismic monitoring, event magnitude analysis, and seismic compliance tracking.
4. Is the dashboard suitable for pilot and demonstration projects?
Yes, it is designed specifically for pilot-scale EGS projects and early-stage commercial validation.
5. How does it support future commercial deployment?
By capturing performance data, connectivity metrics, and thermal trends, it reduces uncertainty and informs scalable EGS design decisions.