
What is a Gastroenterology Hospital Pharmacy Dashboard?
A Gastroenterology Hospital Pharmacy Dashboard is a data-driven visualization tool that helps hospitals monitor, manage, and optimize all pharmacy-related operations across gastroenterology departments. It integrates real-time insights from prescription data, stock availability, sales trends, and financial performance into a unified interface. With this hospital pharmacy analytics tool, administrators can track drug utilization, manage inventory levels, and improve dispensing accuracy. The dashboard ensures that pharmacies in gastroenterology hospitals maintain operational efficiency, minimize wastage, and support better patient outcomes through timely medication delivery.
How to Create a Gastroenterology Hospital Pharmacy Dashboard
You don’t need to build your report from scratch—just start with a ready-to-use dashboard template from Mokkup. Add in your data and export it however you like. Here’s how to do it:
1. Create or Log in to Your Mokkup Account
Start by signing up on Mokkup.ai using your email. If you already have an account, just log in, and you’ll be good to go.
2. Choose and Customize Your Dashboard Template
Find the Gastroenterology Hospital Pharmacy Dashboard template in the Templates section. Use the drag-and-drop editor to adjust KPIs, edit filters, or add elements based on your data.
3. Export to Your BI Tool
Once your dashboard wireframe is ready, use the BI Tool Export feature to send it directly to Power BI or Tableau for further analysis and enhancements. You can also download the dashboard as a PDF, PNG, or JPEG, embed it on a platform, or invite your team to collaborate.
Note: This is a Pro template. You’ll need a Pro subscription on Mokkup to use and customize this dashboard wireframe. Upgrade anytime to unlock full access.
Gastroenterology Hospital Pharmacy Dashboard Example
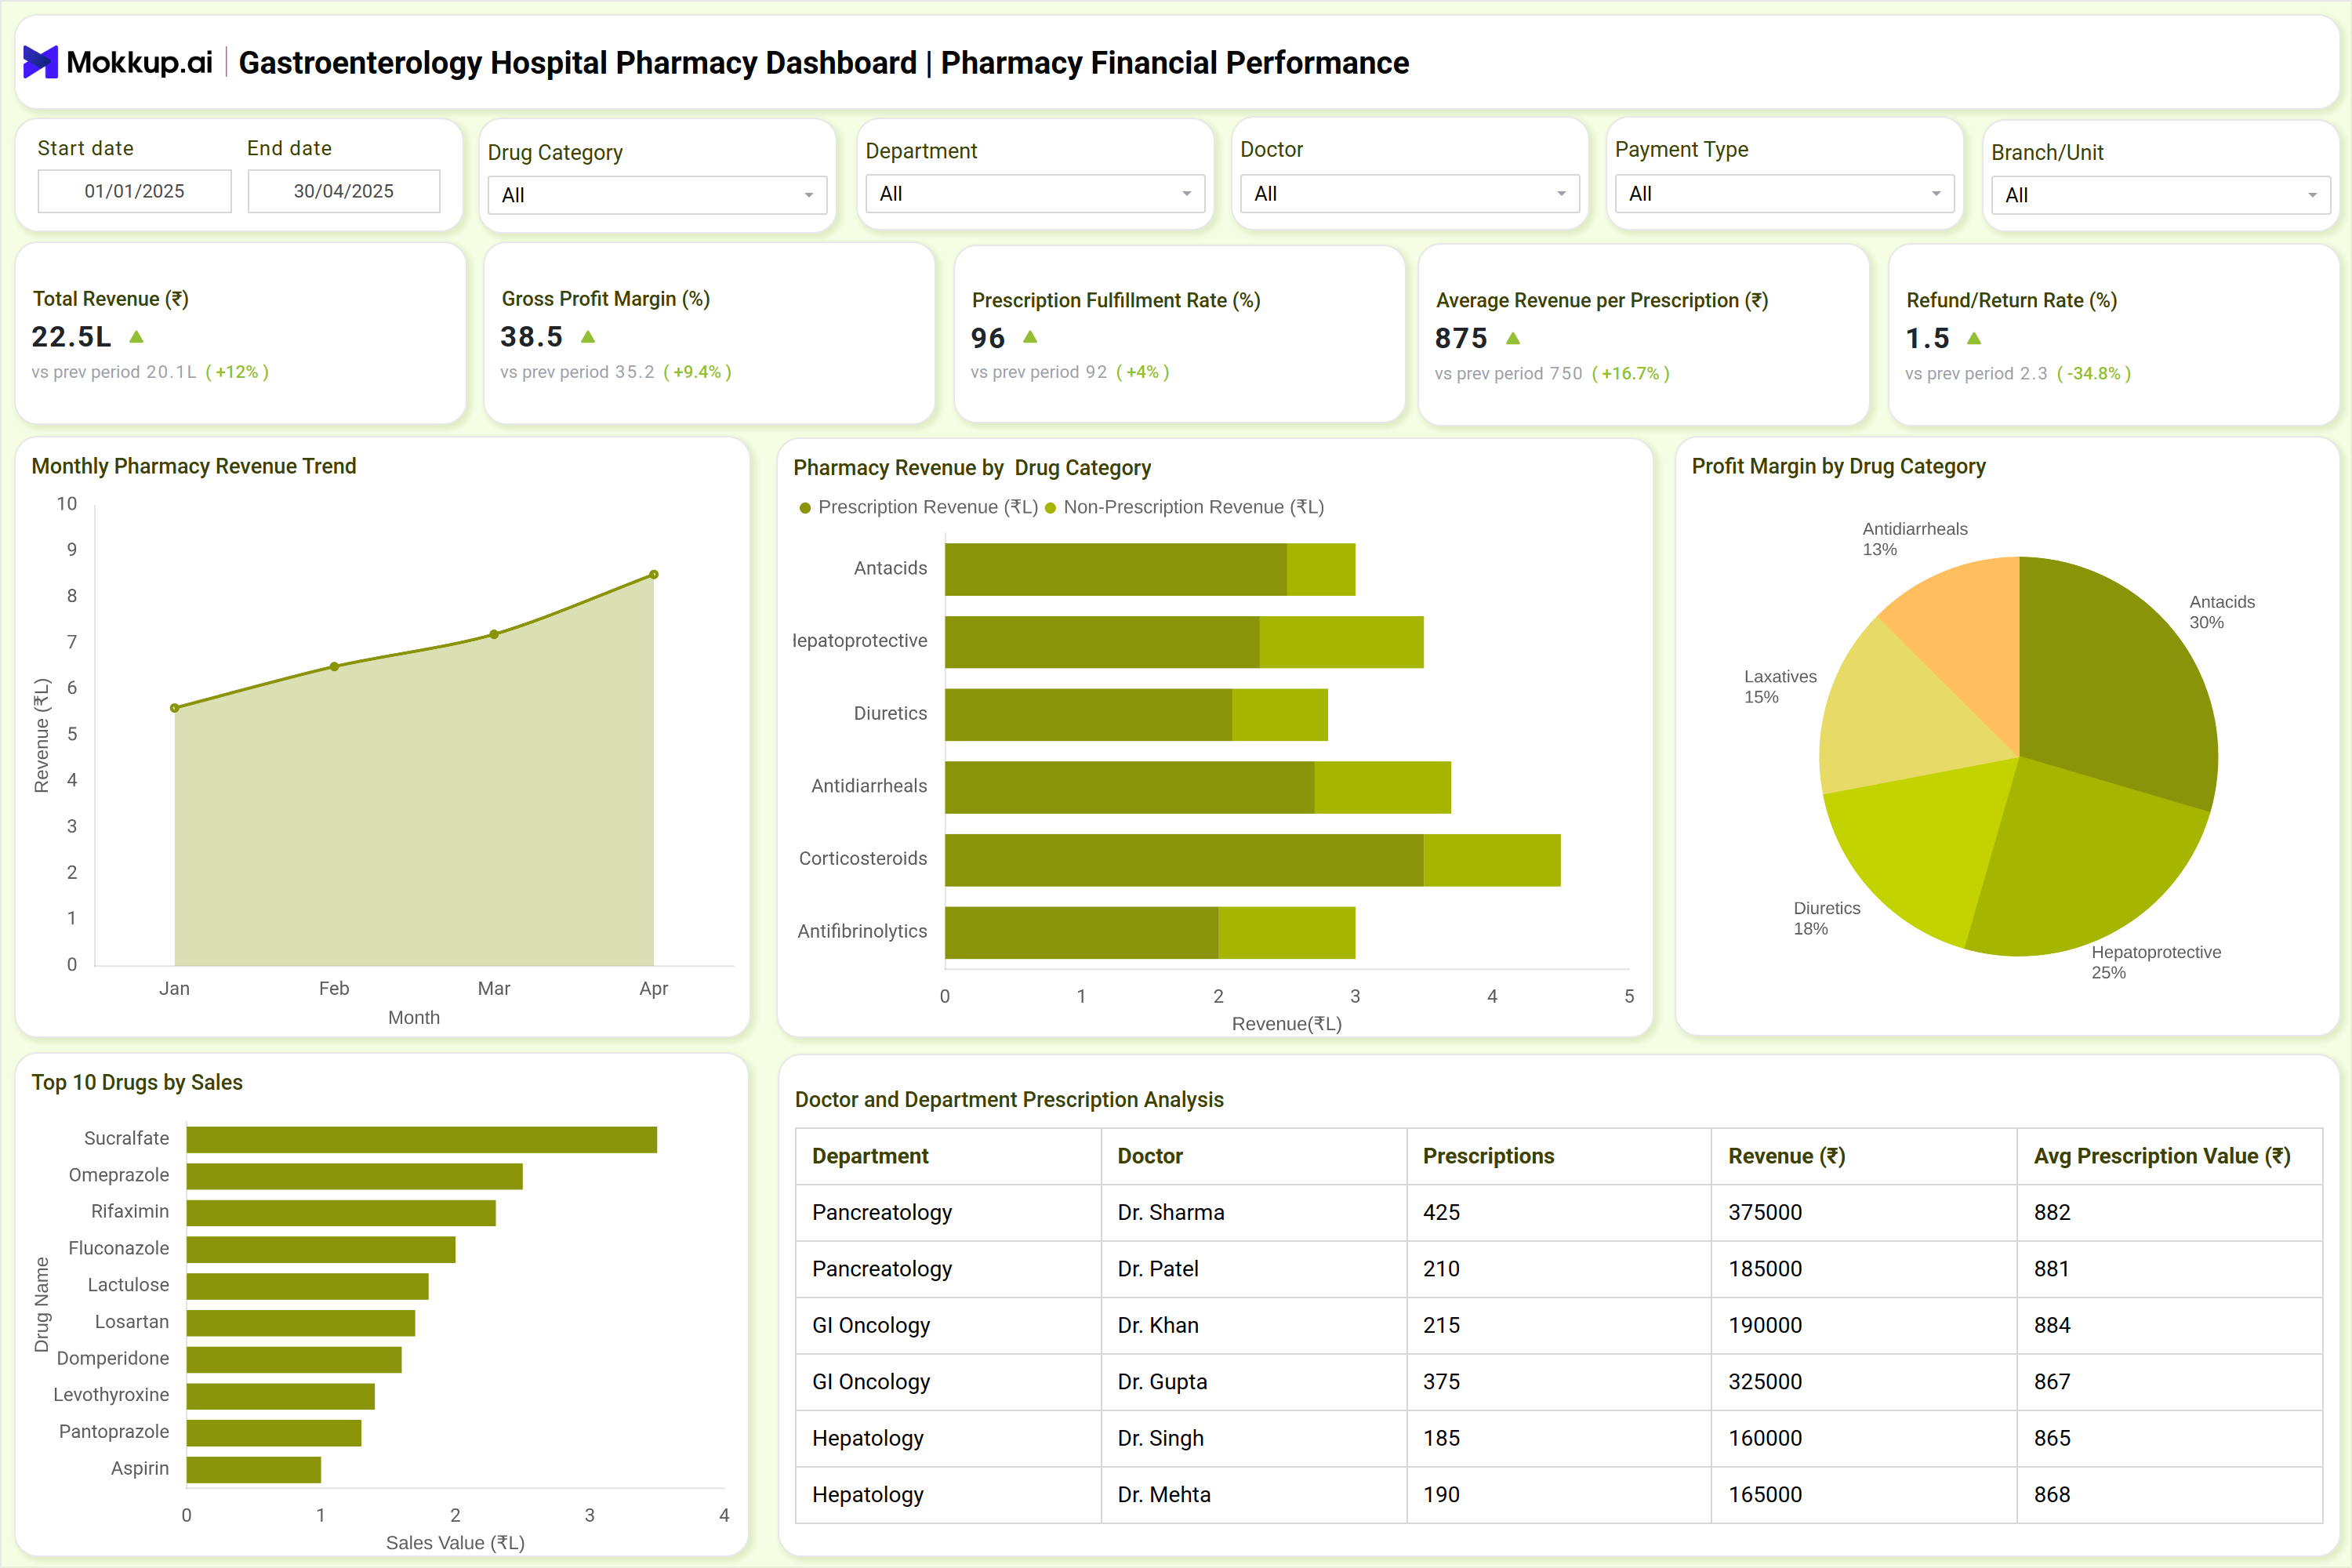
You can create your own Gastroenterology pharmacy management dashboard by combining modules focused on dispensing operations, stock management, and financial insights. In this example, the dashboard includes three main views: the Pharmacy Operations Dashboard, which tracks prescriptions, dispensing time, and pharmacist performance; the Pharmaceutical Inventory Management Dashboard, which monitors stock levels, turnover, and expiry rates; and the Pharmacy Financial Performance Dashboard, which evaluates revenue, profit margins, and category-wise profitability. Together, these sections provide healthcare leaders with comprehensive insights into GI clinic pharmacy, enabling more thoughtful decision-making, more effective procurement planning, and enhanced operational transparency across departments.
How to Analyze Data in Gastroenterology Hospital Pharmacy Dashboard
Here is how you can analyze data from this dashboard:
- Monitor dispensing efficiency: Analyze average dispensing times and prescription fulfillment rates to assess operational productivity.
- Evaluate prescription patterns: Compare OPD, IPD, and emergency prescriptions to optimize resource allocation.
- Track inventory performance: Utilize inventory turnover and expiry reports to minimize drug wastage and enhance stock health.
- Assess supplier reliability: Review reorder lead times and stockout incidents to identify vendor performance issues.
- Measure financial growth: Analyze monthly pharmacy revenue and profit margins across drug categories.
- Compare staff efficiency: Review pharmacist performance metrics such as dispensing time, fulfillment rate, and error percentage.
- Identify high-performing drugs: Track top-selling and high-margin drugs for better demand forecasting.
Benefits of Gastroenterology Hospital Pharmacy Dashboard
Here are benefits of implementing this dashboard:
- Enhanced operational control: Real-time insights into prescriptions and dispensing improve hospital operations and workflow efficiency.
- Accurate inventory management: Automated tracking ensures better planning of stock reorder levels and expiry prevention.
- Data-backed financial insights: The dashboard helps identify revenue trends and profitability by drug or department.
- Optimized resource utilization: By linking staff performance and drug usage, hospitals can better align manpower and stock.
- Reduced wastage and losses: The system tracks near-expiry medicines, minimizing overstocking and ensuring optimal use.
- Better decision-making: Integration of the Gastroenterology drug utilization tracker supports cost-effective purchasing and clinical management.
- Regulatory compliance: Maintains detailed audit trails for prescriptions, inventory, and dispensing accuracy.
KPIs to Track in Gastroenterology Hospital Pharmacy Dashboard
- Prescription Fulfillment Rate (%) – Measures the accuracy and timeliness of filled prescriptions.
- Average Dispensing Time (mins) – Evaluates operational efficiency for OPD and IPD patients.
- Stockout Incidents (#) – Tracks the number of times a drug becomes unavailable.
- Expiry Losses (₹) – Identifies the value of expired or near-expiry drugs.
- Inventory Turnover (days) – Measures how quickly inventory is utilized and replenished.
- Gross Profit Margin (%) – Evaluates profitability across drug categories.
Frequently Asked Questions
1. What is the purpose of a Gastroenterology Pharmacy Dashboard?
It provides real-time visibility into operational, financial, and inventory data specific to gastroenterology hospital pharmacies, supporting better performance monitoring and decision-making.
2. How can the dashboard improve inventory control?
The dashboard provides detailed analysis of hospital medicine inventory, highlighting near-expiry stock, reorder levels, and stock turnover rates for improved procurement planning.
3. Is it useful for financial reporting?
Absolutely. The dashboard serves as a specialty pharmacy performance dashboard, offering insights into cost, revenue, and profit across various drug categories.