The Cost Center Analysis dashboard template is designed to provide a comprehensive view of organizational spending across departments. It tracks key metrics like purchase amount, budget variances, and purchase trends over time. The dashboard wireframe allows users to compare spending between departments and cities, identify cost drivers, and monitor progress toward financial goals. It can empower businesses to optimize spending and improve overall financial health by facilitating informed decision-making around resource allocation.
Key Terms to Know
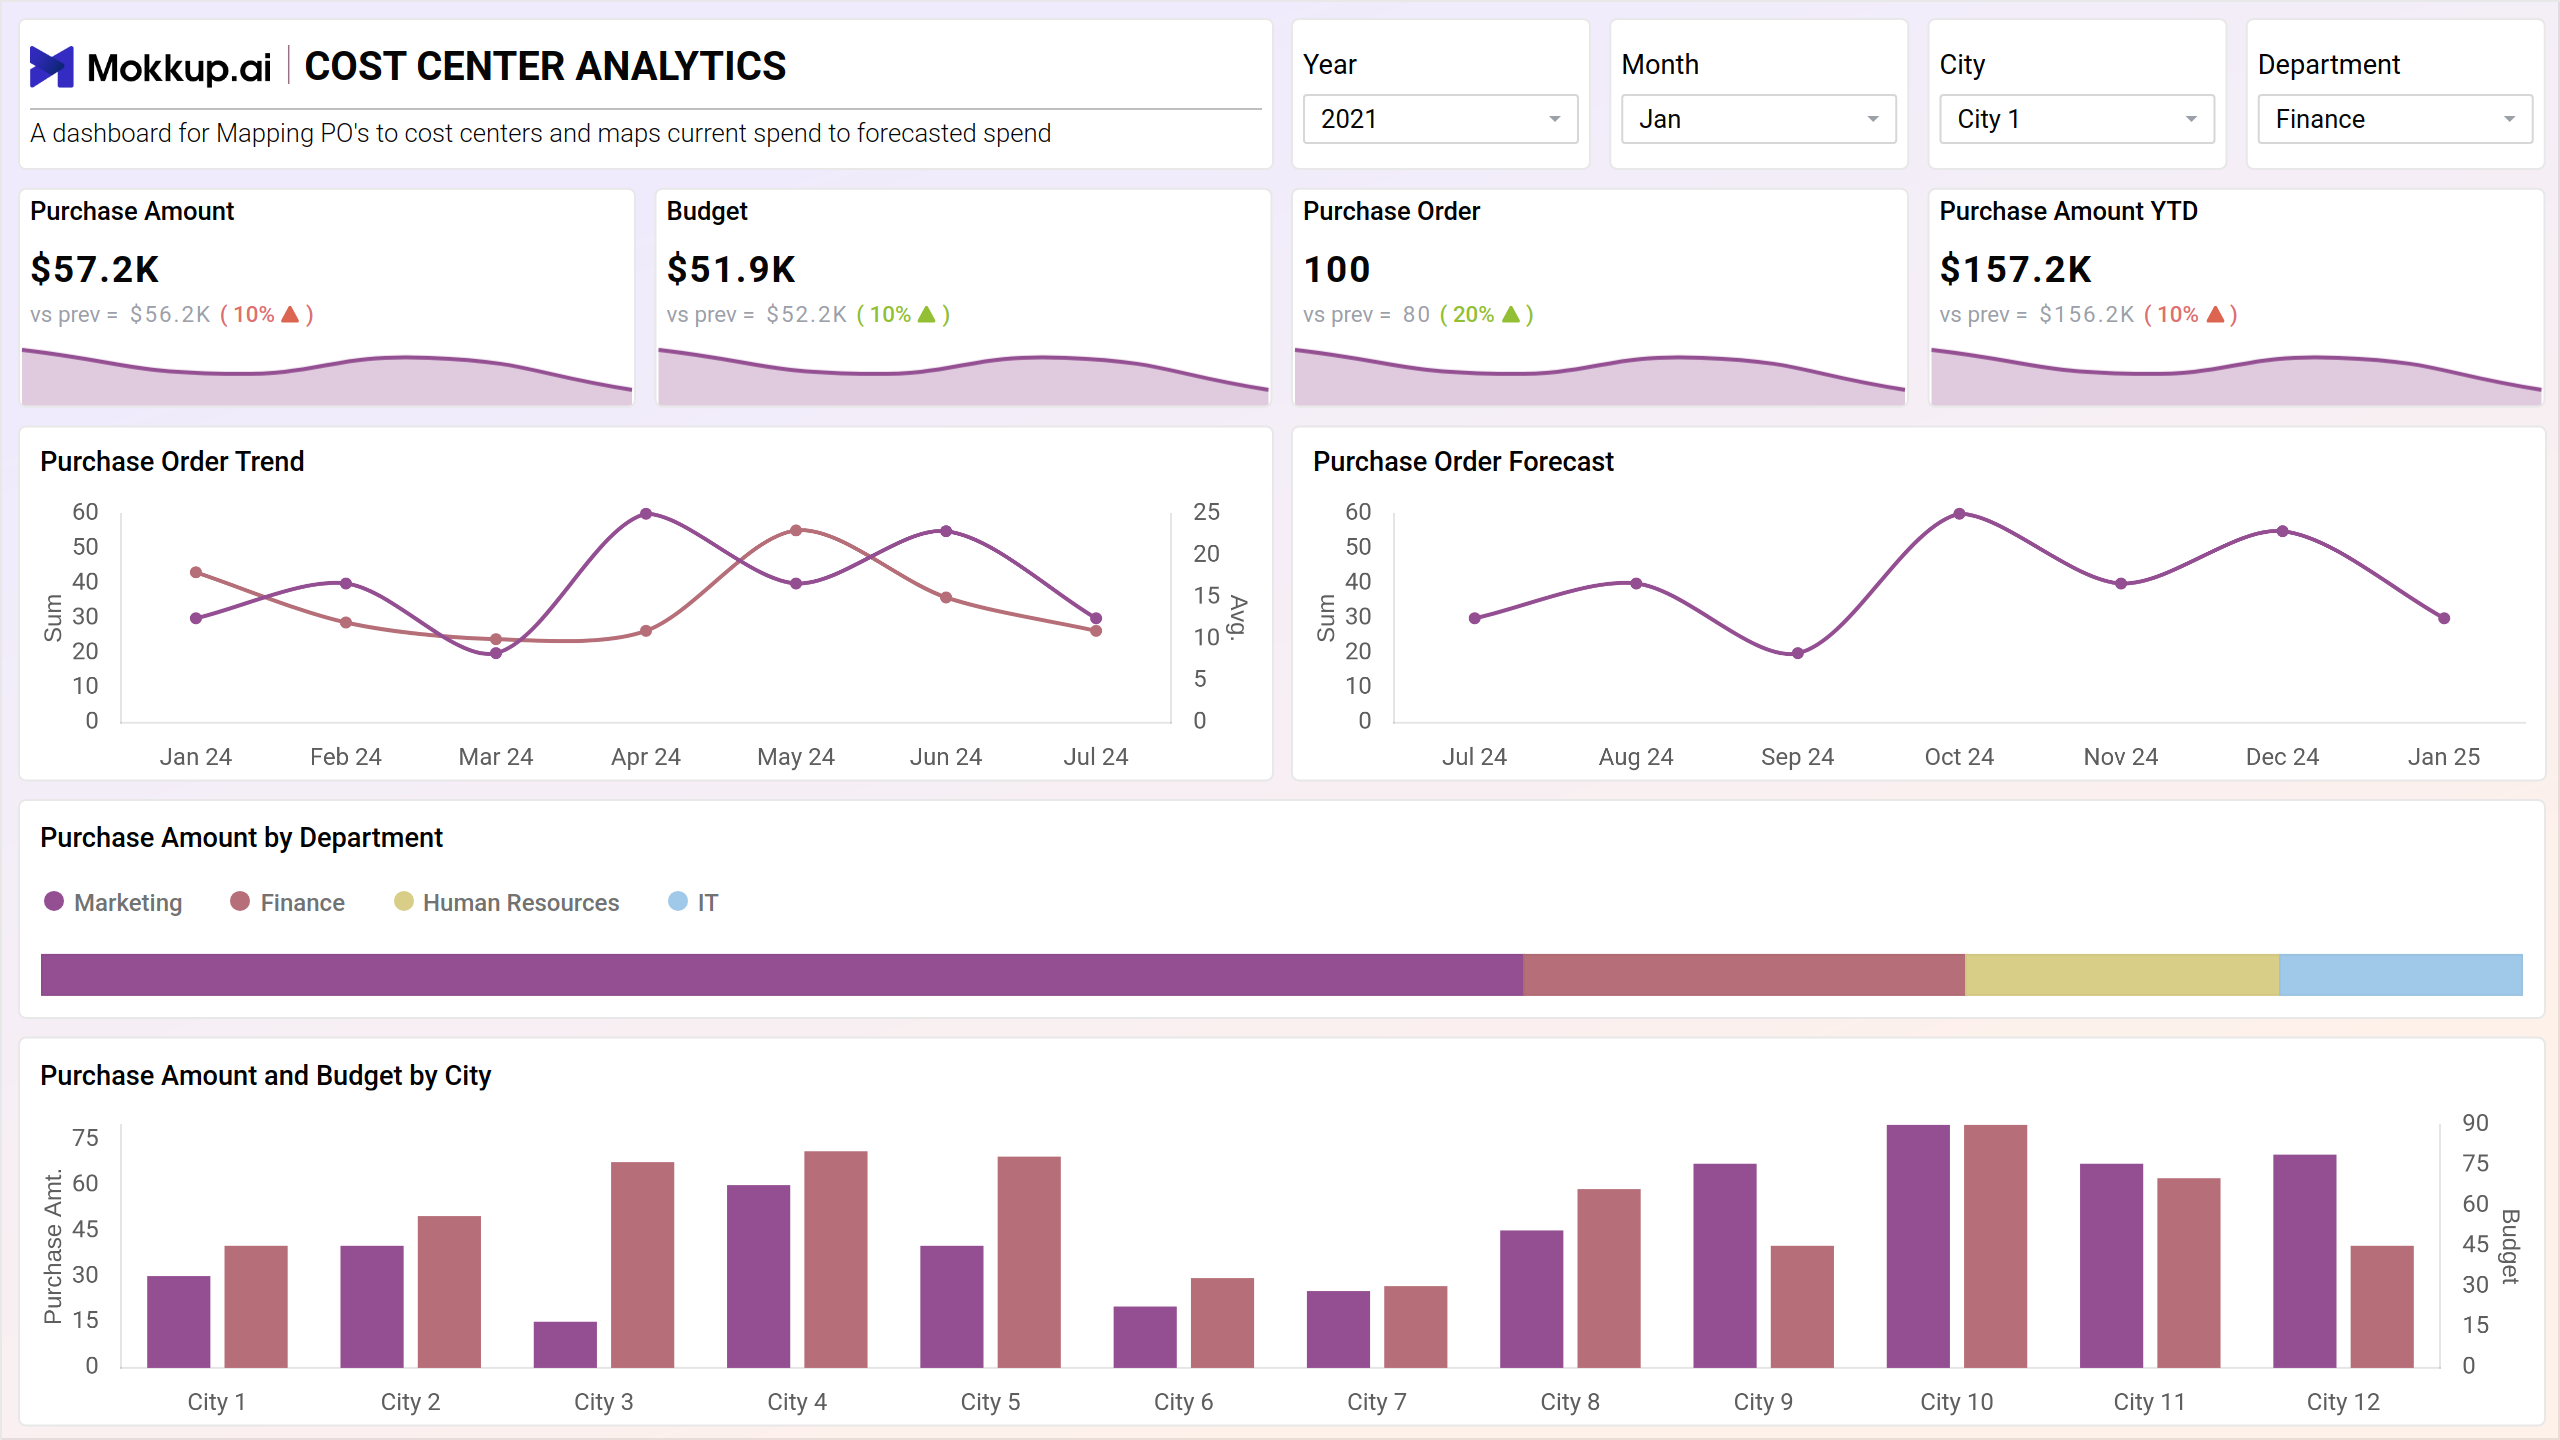
1. Purchase Analysis Metrics:
- Purchase Amount: Total amount spent on purchases.
- Budget: Allocated budget for purchases.
- Purchase Amount YTD (Year-to-Date): Cumulative purchase expenditure for the current fiscal year.
2. Purchase Order Tracking:
- Purchase Orders: Number of purchase orders raised.
- Purchase Order Trend: Trend analysis of purchase order generation over time.
- Purchase Order Forecast: Prediction of future purchase order requirements based on historical data and trends.
3. Departmental and Geographic Analysis:
- Purchase Amount by Department: Breakdown of purchase expenditure by department or cost center.
- Purchase Amount and Budget by City: Analysis of purchase expenditure and budget allocation categorized by geographical locations or cities.
Team Breakdown View
The team breakdown view of the cost center analysis dashboard wireframe offers a comprehensive overview of expenditure and budget management across different teams or departments. It provides insights into budget utilization, purchase amounts, purchase order trends, and identifies areas of concern for effective cost control.
Key Terms to Know
- Budget YTD: Displays the allocated budget year-to-date, enabling comparison with actual expenditure to gauge budget adherence and identify variances.
- Purchase Amount by Team: Breaks down purchase expenditure by individual teams or departments, facilitating targeted analysis and resource allocation based on departmental needs and spending patterns.
- PO and Budget Trend: Tracks the trends in purchase orders and budget utilization over time, allowing for proactive adjustments to spending strategies and resource allocation.
- Worst Performance Cost Center: Highlights cost centers or departments with the poorest performance in terms of budget utilization or exceeding allocated budgets, enabling focused efforts on improving cost management in those areas.
Dashboard Template Insights
Here are some of the important insights this dashboard wireframe offers:
- Enables stakeholders to identify expense sources, enhancing budget management.
- With trend analysis and forecasting, future costs can be anticipated for timely actions.
- Attributes expenses to departments, fostering transparency and responsible spending.
- Facilitates transparent financial performance discussions within the organization.
Conclusion
Cost Center Analysis dashboard template is crucial for businesses seeking to enhance efficiency and profitability. Through strategic cost control, data-driven decision-making, and targeted resource allocation, organizations can optimize budget utilization and gain a competitive edge.
The team breakdown view facilitates proactive management by providing insights into budget utilization and purchase amounts, enabling businesses to make informed adjustments and drive effective cost management strategies for sustained success.