
What is an Eye Hospital Test Utilization & Volume Dashboard?
An Eye Hospital Test Utilization & Volume Dashboard template is a healthcare analytics tool that tracks diagnostic testing performance across labs and clinics. It consolidates key KPIs such as test volume, utilization rate, turnaround time, technician productivity, test-to-diagnosis conversion, and abnormal findings.
The Eye Hospital Test Utilization and Volume dashboard template provides real-time visibility into lab efficiency and diagnostic accuracy. As a real-time diagnostic performance monitoring dashboard, it ensures clinics optimize machine usage, reduce delays, and improve patient outcomes.
How To Create Eye Hospital Test Utilization & Volume Dashboard
You don’t need to build your report from scratch—just start with a ready-to-use Eye Hospital Test Utilization & Volume Dashboard template from Mokkup. Add in your data and export it however you like. Here’s how to do it:
1. Create or Log in to Your Mokkup Account
Start by signing up on Mokkup.ai using your email. If you already have an account, just log in, and you’ll be good to go.
2. Choose and Customize Your Dashboard Template
Find the Eye Hospital Test Utilization & Volume Dashboard template in the Templates section. Use the drag-and-drop editor to adjust KPIs, edit filters, or add elements based on your data.
3. Export to Your BI Tool
Once your dashboard wireframe is ready, use the BI Tool Export feature to send it directly to Power BI or Tableau for further analysis and enhancements. You can also download the dashboard as a PDF, PNG, or JPEG, embed it on a platform, or invite your team to collaborate.
Note: This is a Pro template. You’ll need a Pro subscription on Mokkup to use and customize this dashboard wireframe. Upgrade anytime to unlock full access.
Eye Hospital Test Utilization & Volume Dashboard Example
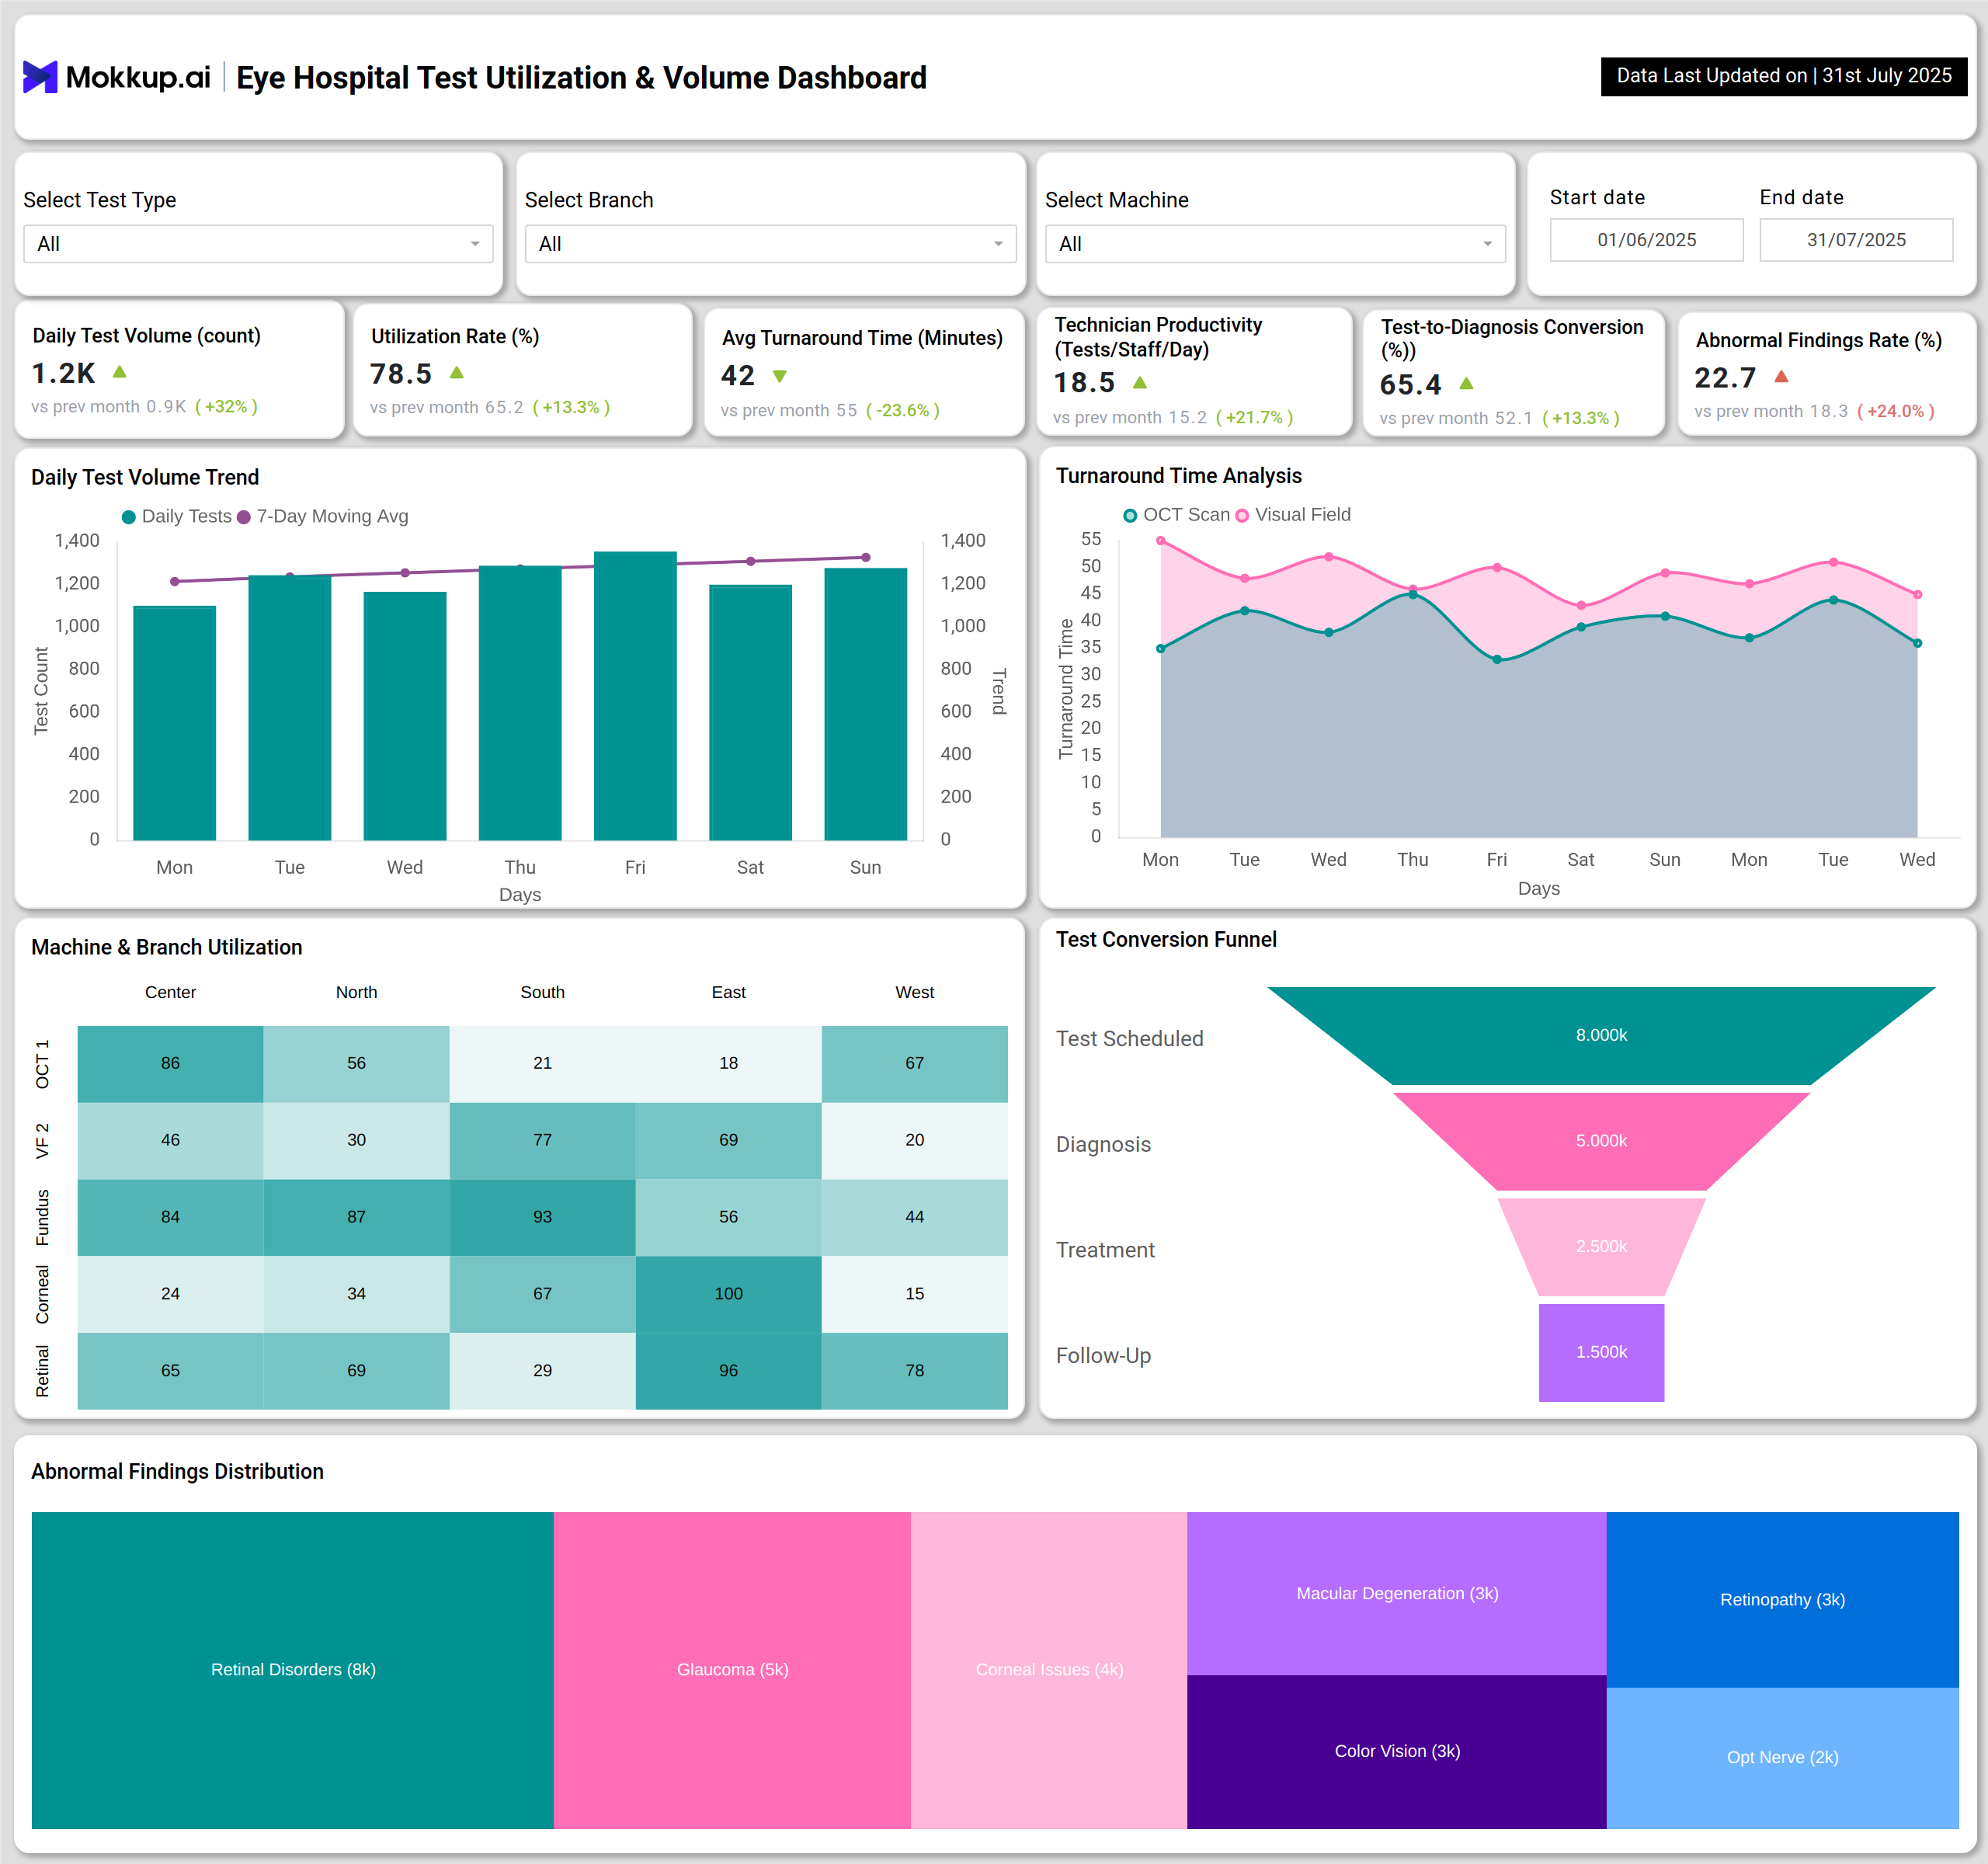
The example dashboard illustrates how healthcare organizations can monitor diagnostic performance across branches and machines. At the top, KPIs display daily test volume, utilization rate, turnaround time, productivity, test-to-diagnosis conversion, and abnormal findings rate. These metrics provide a quick view of both operational efficiency and clinical accuracy.
Charts include a Daily Test Volume Trend showing test volumes over time and a Turnaround Time Analysis highlighting diagnostic delays for OCT scans and visual field tests. A Machine & Branch Utilization heatmap tracks how equipment is used across locations, while the Test Conversion Funnel follows patients through stages from scheduling to follow-up.
The Abnormal Findings Distribution treemap breaks down diagnostic results, identifying common conditions such as retinal disorders, glaucoma, macular degeneration, and corneal issues. This diagnostic efficiency dashboard provides a complete view of lab operations, test conversion, and abnormal result patterns, helping clinics improve both workflow and patient care.
How to Analyze Data in Eye Hospital Test Utilization & Volume Dashboards
Healthcare providers can use an eye hospital test utilization and volume dashboard template by:
- Monitoring Test Volumes: Track daily and weekly volumes to ensure labs meet demand.
- Evaluating Turnaround Times: Use the real-time diagnostic performance monitoring dashboard to identify testing delays.
- Reviewing Equipment Utilization: Analyze heatmaps to maximize machine efficiency across branches.
- Tracking Test Conversion Rates: Treat the dashboard as an incident tracking and diagnostic dashboard to measure how many tests lead to confirmed diagnoses and treatments.
- Analyzing Abnormal Findings: Use condition-specific distribution data to detect emerging patient trends.
Benefits of Eye Hospital Test Utilization & Volume Dashboards
Adopting a Eye Hospital Test Utilization & Volume Dashboard offers multiple benefits:
- Optimized Lab Efficiency: The test utilization and volume dashboard template ensures equipment and staff are fully utilized.
- Faster Diagnostics: The real-time diagnostic performance monitoring dashboard reduces delays in turnaround times.
- Improved Patient Outcomes: Abnormal findings analysis helps identify at-risk patient groups earlier.
- Better Resource Allocation: Heatmaps highlight underused machines and overburdened branches.
- Data-Driven Decisions: The diagnostic efficiency dashboard provides evidence-based insights to enhance clinical and operational performance.
KPIs to Track in Eye Hospital Test Utilization & Volume Dashboards
Here's a list of key performance indicators you can track in the dashboard wireframe:
- Daily Test Volume (count): Measures the number of tests processed per day, reflecting lab capacity.
- Utilization Rate (%): Tracks how effectively diagnostic machines are used across branches.
- Average Turnaround Time (minutes): Evaluates how quickly results are delivered, reducing patient waiting times.
- Test-to-Diagnosis Conversion (%): Shows how many tests result in actionable diagnoses, reflecting clinical effectiveness.
- Abnormal Findings Rate (%): Monitors abnormal results to identify trends and prioritize interventions.
Frequently Asked Questions
Q1. Why is an Eye Hospital Test Utilization & Volume Dashboard important?
It provides real-time visibility into testing efficiency, conversion rates, and abnormal findings, ensuring better diagnostic workflows.
Q2. Which healthcare facilities benefit most from this dashboard?
Hospitals, eye care centers, diagnostic labs, and multi-branch clinics benefit from a Test Utilization & Volume dashboard.
Q3. Do I need technical expertise to use this dashboard?
No. The Eye Hospital Test Utilization & Volume Dashboard template is designed with a drag-and-drop editor, making it simple for healthcare staff to customize KPIs, filters, and charts without coding or design skills.