
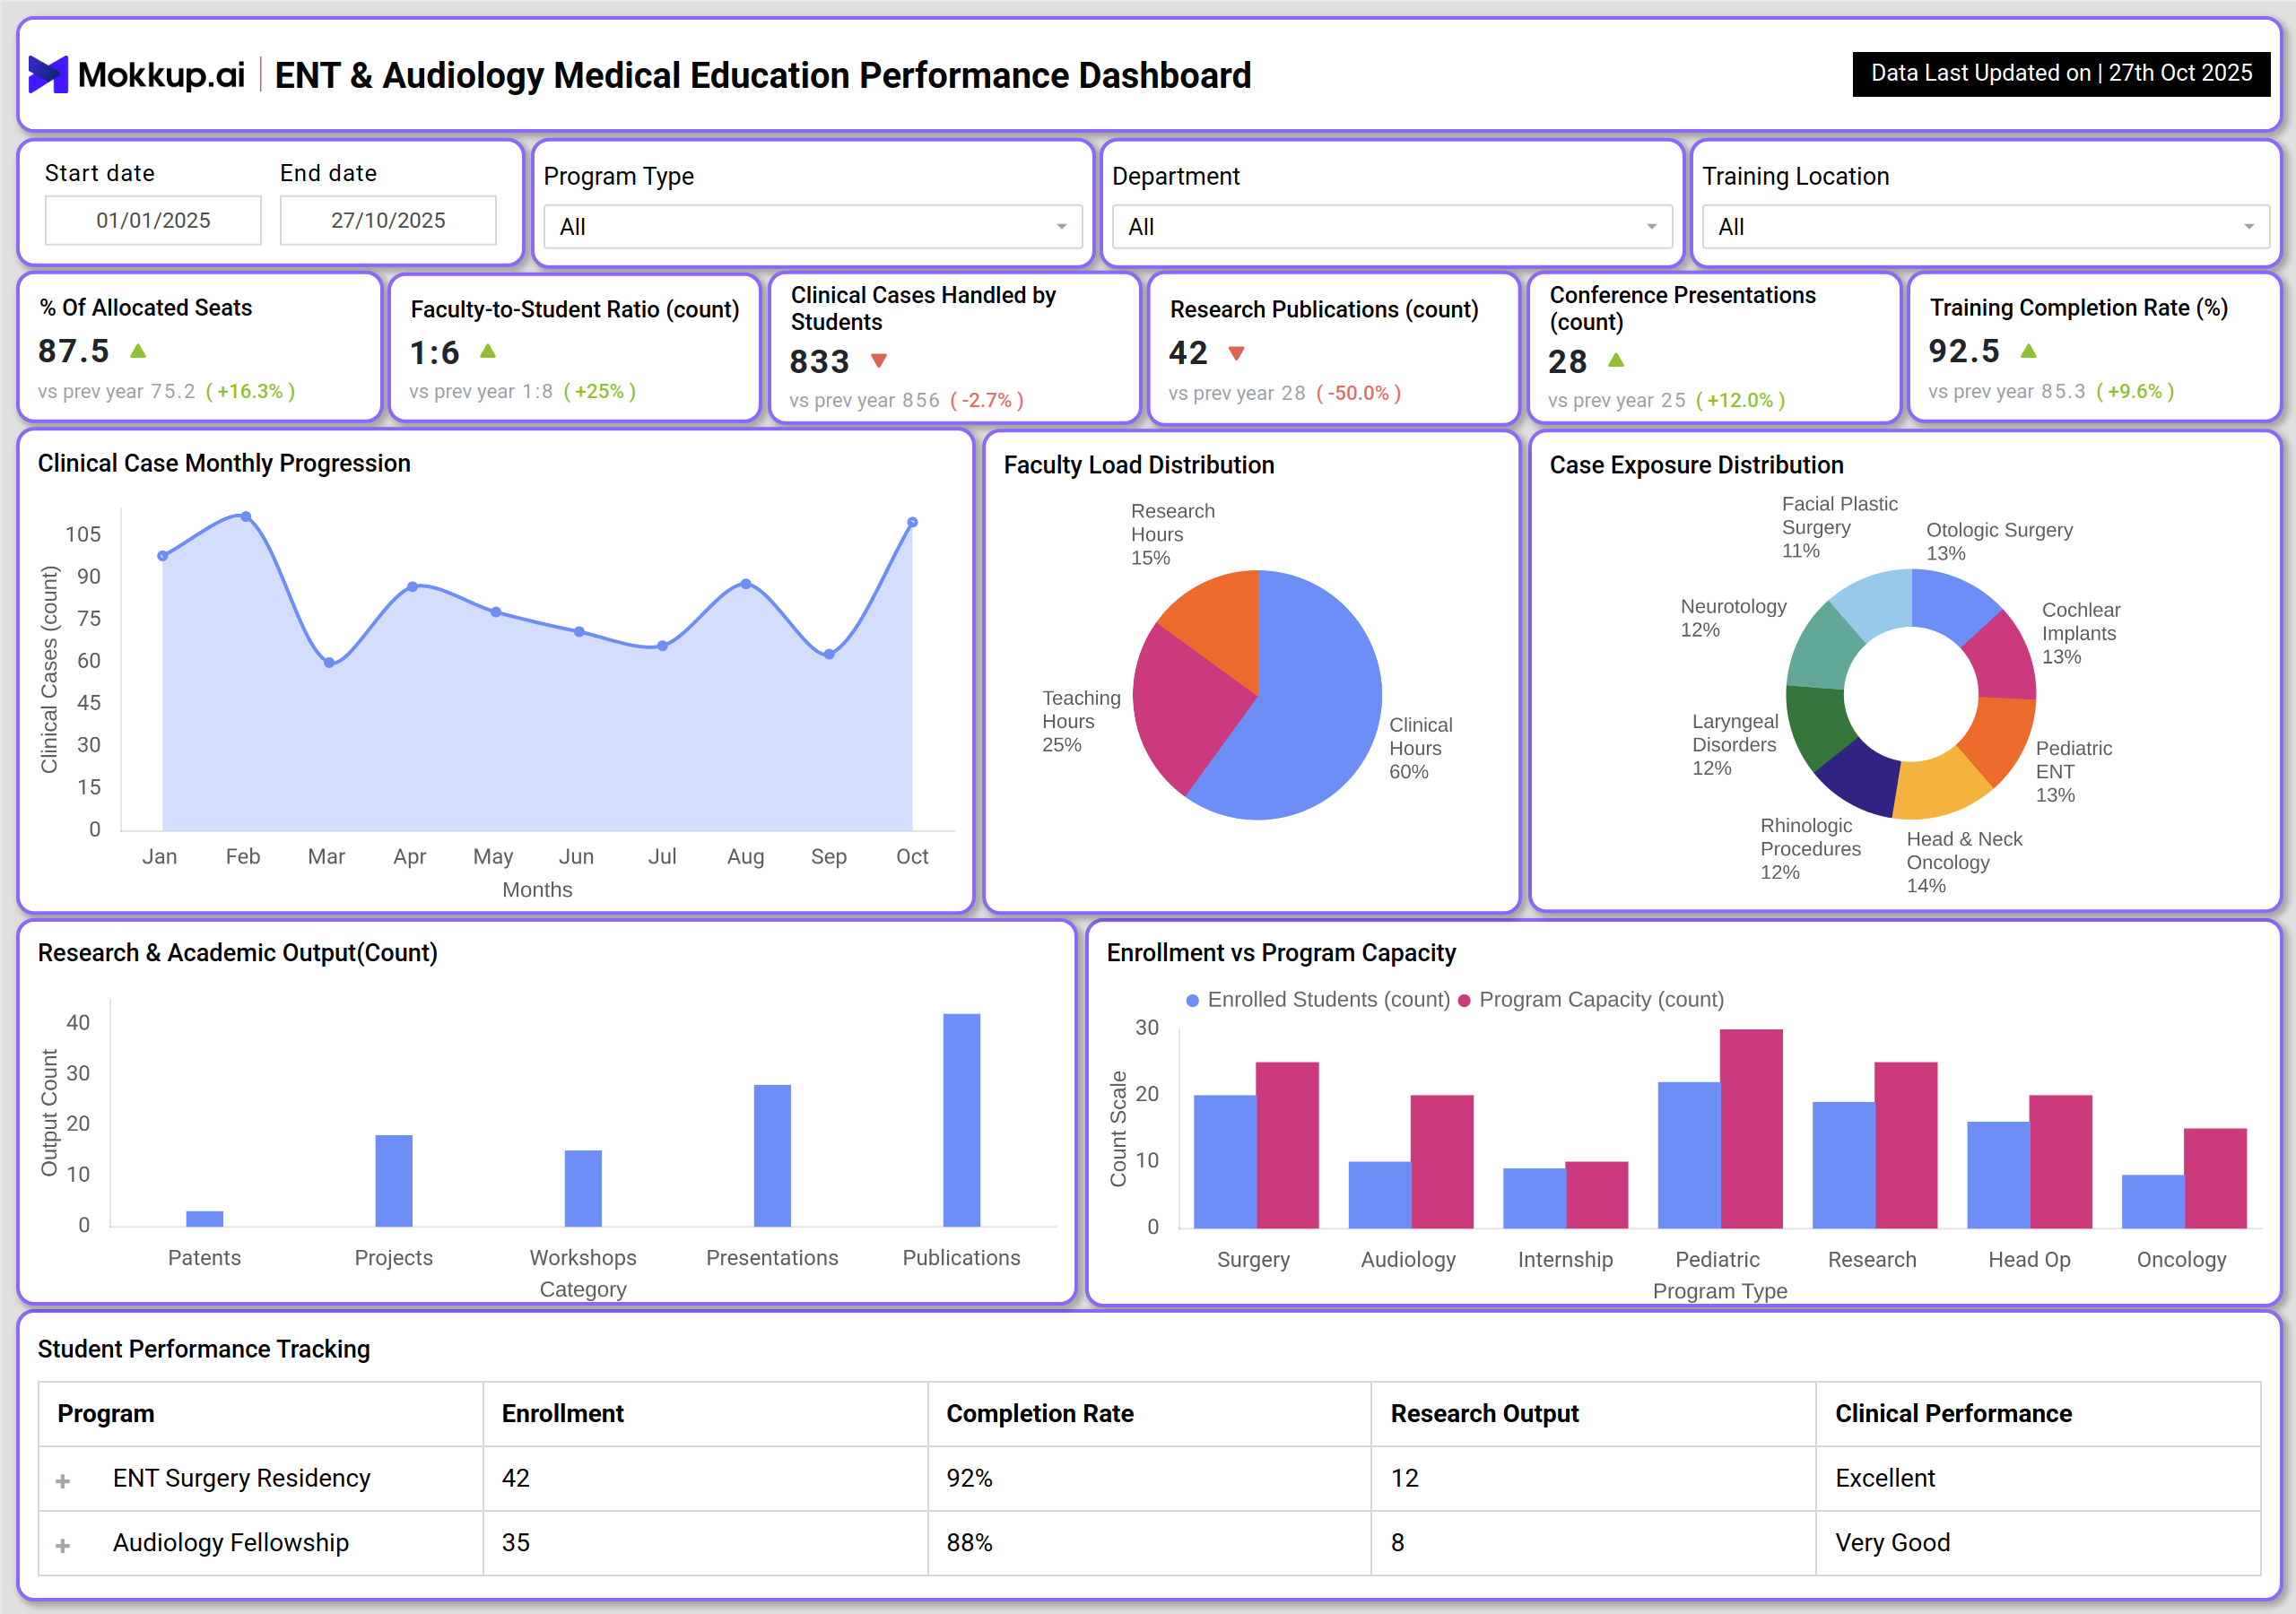
What is an ENT & Audiology Medical Education Performance Dashboard?
An ENT education dashboard & Audiology training analytics solution is a centralized analytics platform for tracking academic performance, competency development, and operational efficiency in ENT & Audiology programs. It monitors enrollment utilization, clinical exposure, faculty availability, research output, and training completion outcomes. The dashboard enables program directors and clinical educators to proactively identify learning gaps, support struggling students, ensure the delivery of a competency-based curriculum, and enhance institutional accreditation readiness through real-time insights.
How to Create an ENT & Audiology Education Dashboard
You don’t need to build your report from scratch-just start with a ready-to-use ENT & audiology education dashboard template from Mokkup. Add your data and export it as needed. Here’s how to do it:
1. Create or Log in to Your Mokkup Account
Start by signing up on Mokkup.ai using your email. If you already have an account, simply log in, and you’ll be all set.
2. Choose and Customize Your Dashboard Template
Find the ENT & Audiology Education Dashboard template in the Templates section. Use the drag-and-drop editor to adjust KPIs, edit filters, or add elements based on your data.
3. Export to Your BI Tool
Once your dashboard wireframe is ready, use the BI Tool Export feature to send it directly to Power BI or Tableau for further analysis and enhancements. You can also download the dashboard as a PDF, PNG, or JPEG, embed it on a platform, or invite your team to collaborate.
Note: This is a Pro template. You’ll need a Pro subscription on Mokkup to use and customize this dashboard wireframe. Upgrade anytime to unlock full access.
ENT & Audiology Medical Education Dashboard Example
This screen focuses on overall program capacity, Medical education performance tracking, Clinical exposure monitoring, faculty effort distribution, academic productivity, and training progression. It enables leadership to assess whether enrollment is optimized, students are getting adequate hands-on experience, and faculty workload remains balanced. The view also monitors research contribution and student competency growth over time. Key indicators include Enrollment vs Capacity, Clinical Cases per Student, Faculty Hours Allocation, Research Output Volume, and Competency Achievement Rate. It supports accreditation readiness and highlights areas needing corrective action. Overall, it drives data-backed improvements in education analytics and student outcomes.
How to Analyse Data in an ENT & Audiology Education Dashboard
Here’s how to analyze data in ENT & Audiology Education Dashboards:
- Monitor learning progress: Track key KPIs such as seat fill %, student exposure, and completion rates to ensure capacity is utilized effectively and learners are progressing as planned.
- Evaluate batch performance: Compare batch and program-level outcomes to identify gaps in clinical readiness and highlight where additional hands-on exposure or academic support is needed.
- Optimize training utilization: Identify underused training sites and high-demand periods to improve scheduling, rotation distribution, and infrastructure use.
- Balance faculty workload: Review teaching and research hours through Faculty Workload Analytics to prevent burnout and ensure students receive proper guidance and supervision.
- Drill into performance trends: Filter by academic year, site, or program to uncover performance variations across cohorts, campuses, or specializations and focus improvement efforts accordingly.
Benefits of an ENT & Audiology Education Dashboard
This dashboard offers several benefits as follows:
- Track student performance: Gain real-time visibility into academic progress, seat utilization, and program efficiency.
- Improve clinical exposure: Optimize training rotations to ensure balanced hands-on experience and competency achievement.
- Identify learning gaps early: Detect underperforming students and provide timely academic or clinical support.
- Balance faculty workload: Use Faculty Workload Analytics to distribute teaching, supervision, and research responsibilities effectively.
- Simplify audits and accreditation: Generate structured, data-backed reports through the Research Productivity Dashboard.
- Enhance academic governance: Support data-driven decisions for program directors and institutional leaders.
KPIs to Track in an ENT & Audiology Education Dashboard
Here are the core KPIs every Trauma Center ICU Utilization Dashboard should include:
- Enrollment Utilization (%) – Allocated seat usage: Measures how effectively available program seats are filled within the ENT education dashboard and Audiology training analytics, indicating demand, planning efficiency, and resource optimization.
- Faculty-to-Student Ratio – Academic supervision effectiveness: Assesses whether sufficient faculty are available to provide quality teaching, clinical supervision, and mentoring support as part of Medical education performance tracking.
- Clinical Cases Handled By Students – Practical exposure strength: Reflects the depth of hands-on learning by tracking real patient interactions aligned with competency requirements through Clinical exposure monitoring.
- Research Publications (Count) – Institutional research productivity: Captures the volume of scientific outputs produced by students and faculty, demonstrating research engagement in ENT & Audiology programs.
- Conference Presentations (Count) – Academic contribution visibility: Indicates how frequently academic work is showcased externally, strengthening institutional reputation and collaboration.
- Training Completion Rate (%) – Success rate of student progression: Tracks how many students successfully finish the program within the expected timeline, highlighting training effectiveness and student support quality.
Frequently Asked Questions
1. How does monitoring enrollment efficiency help performance?
It ensures programs are right-sized and identifies unmet demand or underutilized seats, supporting better planning and budgeting.
2. Why track faculty workloads and clinical exposure together?
Faculty availability directly impacts hands-on learning; balancing both improves teaching quality and student competency growth.
3. How does research output improve education outcomes?
Higher publication and presentation activity encourages innovation, provides academic recognition, and enhances institutional reputation.