
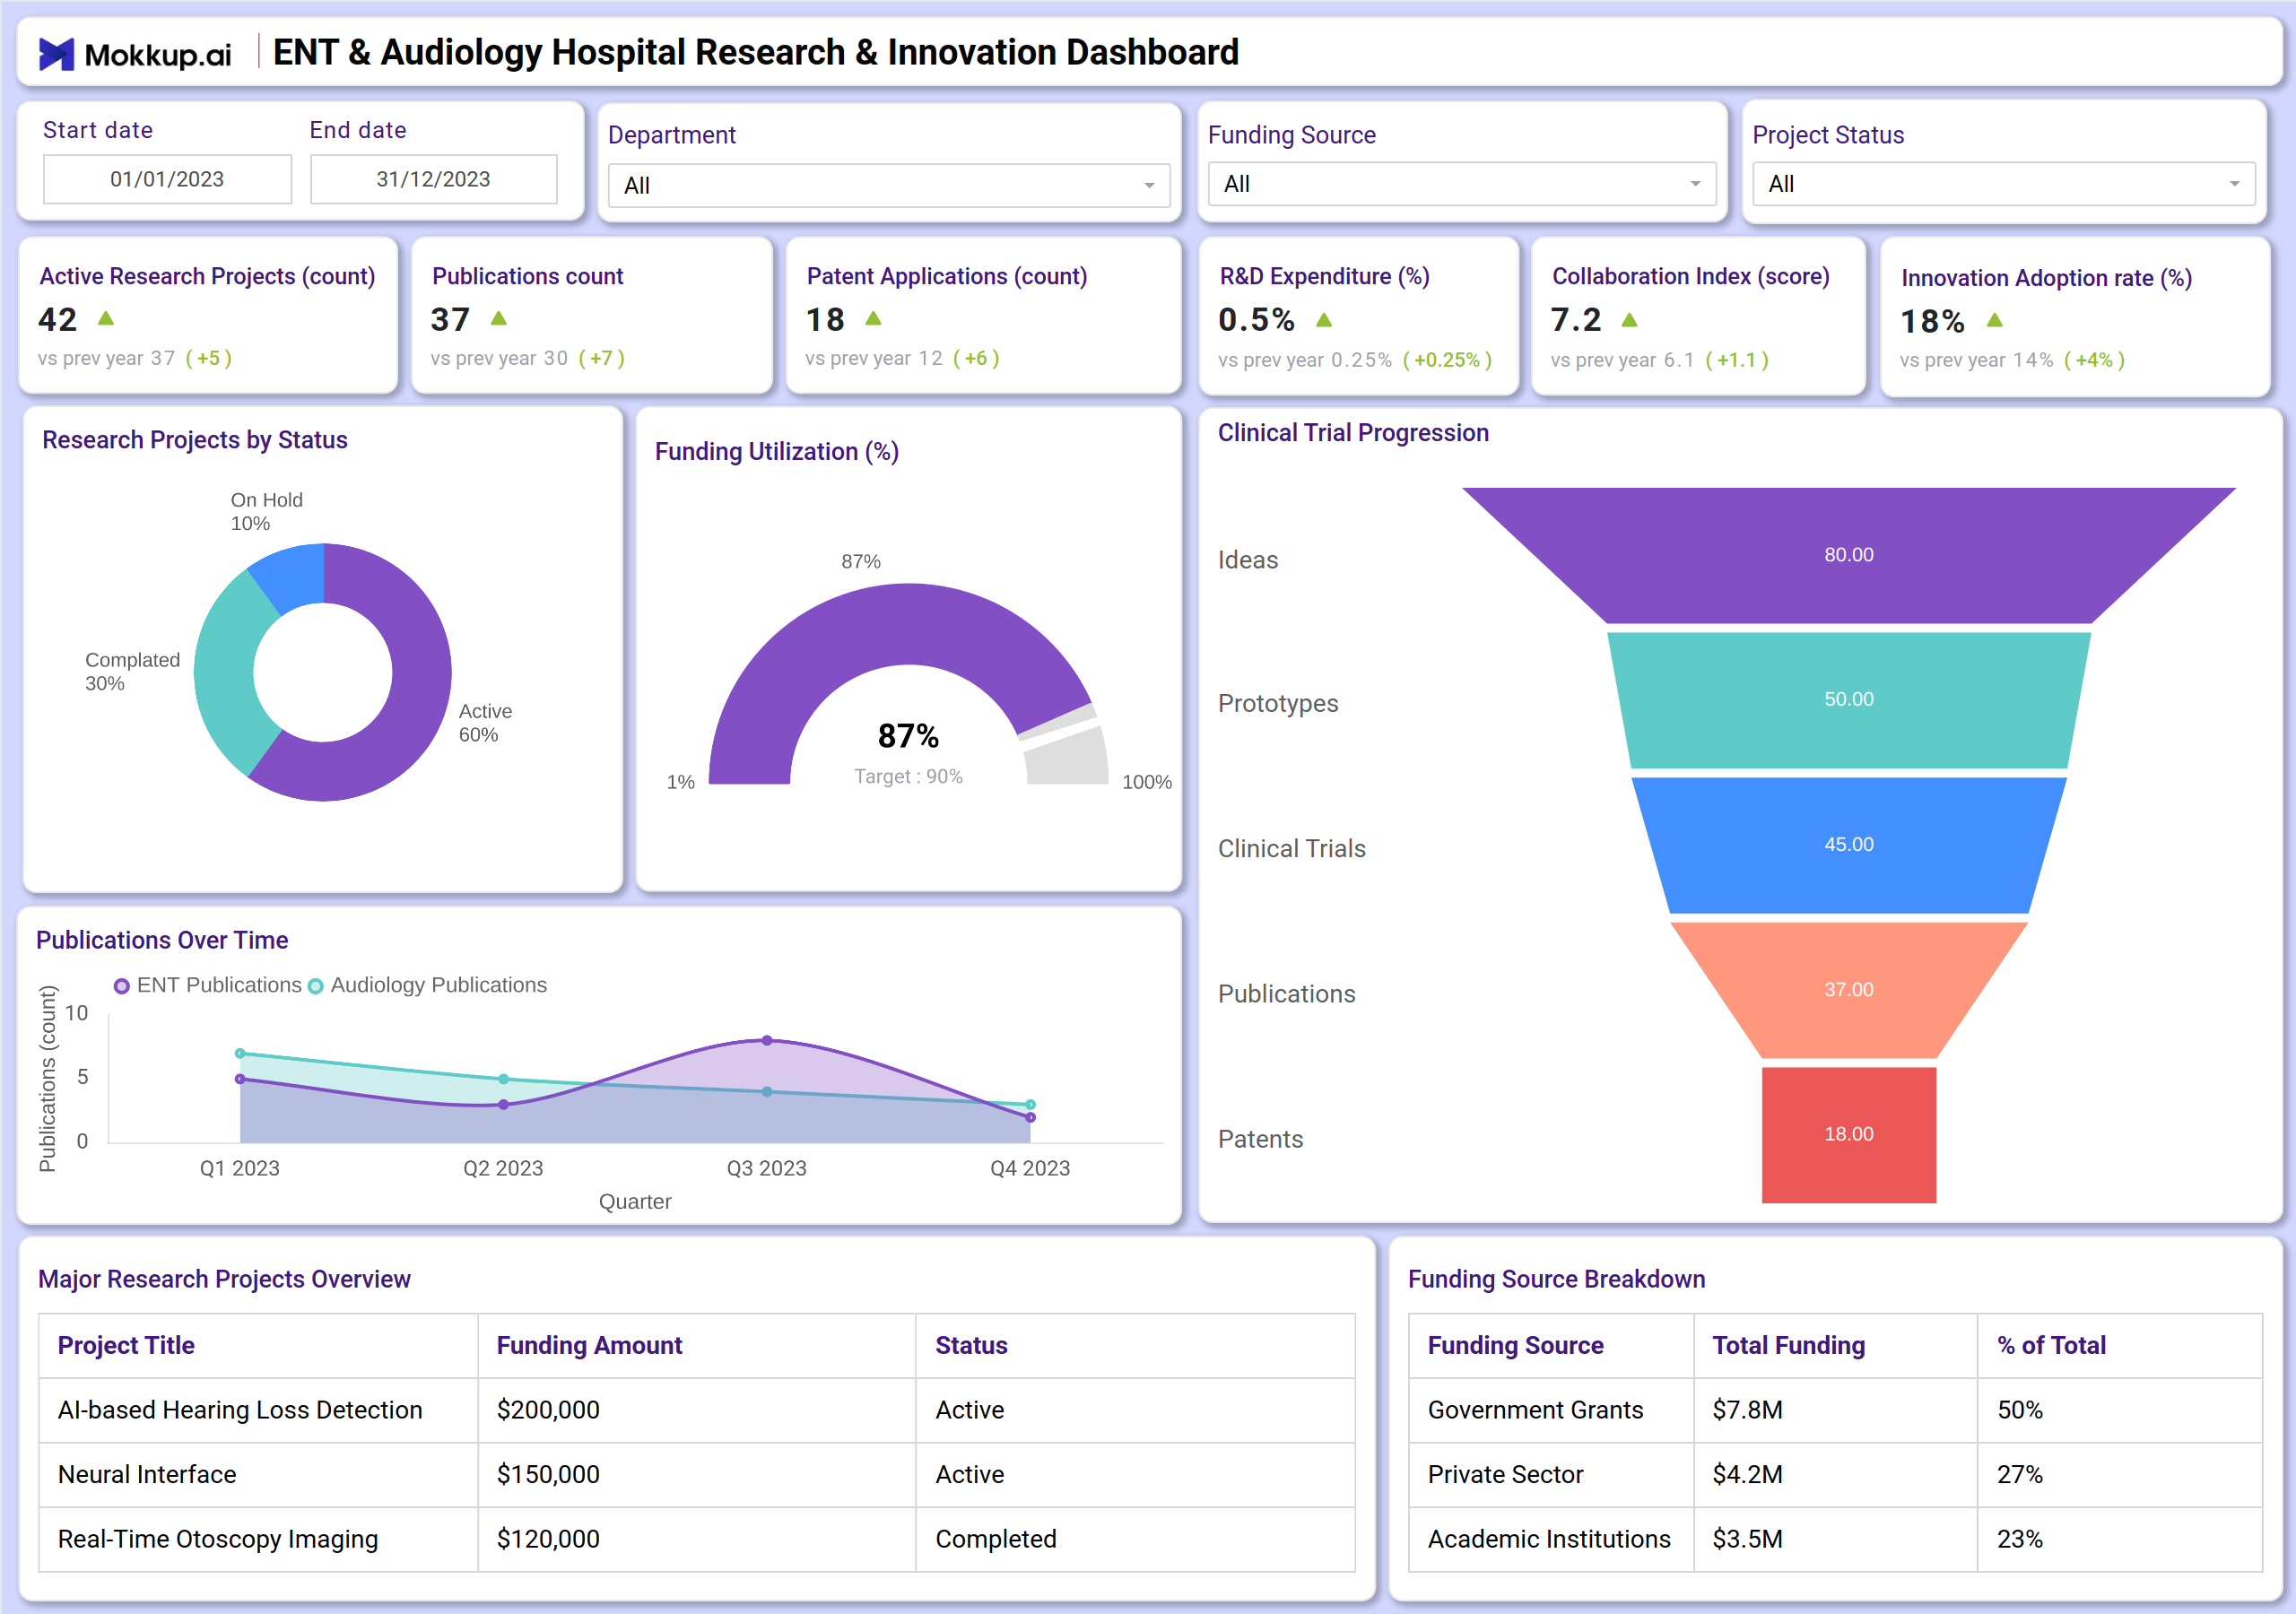
What is an ENT & Audiology Hospital Research & Innovation Dashboard?
An ENT & Audiology Hospital Research & Innovation Dashboard is a centralized tool designed for hospital leadership, research directors, and innovation teams to monitor research performance, track innovation outcomes, and manage grants and patents in real time. It provides visibility into active projects, publication counts, patent applications, R&D expenditure, collaboration scores, and innovation adoption rates. Unlike static reports, this dashboard acts as a real-time ENT & audiology research performance dashboard, helping institutions track scientific output, funding efficiency, and innovation impact in one place.
How to Create an ENT & Audiology Hospital Research & Innovation Dashboard
You don’t need to build your report from scratch—just start with a ready-to-use ENT & Audiology Hospital Research & Innovation Dashboard template from Mokkup. Add in your data and export it however you like. Here’s how to do it:
1. Create or Log in to Your Mokkup Account
Start by signing up on Mokkup.ai using your email. If you already have an account, just log in, and you’ll be good to go.
2. Choose and Customize Your Dashboard Template
Find the ENT & Audiology Hospital Research & Innovation Dashboard template in the Templates section. Use the drag-and-drop editor to adjust KPIs, edit filters, or add elements based on your data.
3. Export to Your BI Tool
Once your dashboard wireframe is ready, use the BI Tool Export feature to send it directly to Power BI or Tableau for further analysis and enhancements. You can also download the dashboard as a PDF, PNG, or JPEG, embed it on a platform, or invite your team to collaborate.
Note: This is a Pro template. You’ll need a Pro subscription on Mokkup to use and customize this dashboard wireframe. Upgrade anytime to unlock full access.
ENT & Audiology Hospital Research & Innovation Dashboard Example
You can create an ENT & Audiology Hospital Research & Innovation Dashboard with a mix of KPI tiles and visualizations. At the top, KPI cards track key metrics, including active research projects, publication count, patent applications, R&D expenditure, collaboration index, and innovation adoption rate. Below that, charts display trends in publications over time, funding utilization, clinical trial progression, and a breakdown of funding sources. Bar and line charts help monitor project status, major research initiatives, and the impact of collaboration. Together, this dashboard serves as a comprehensive tool for tracking ENT & audiology research and innovation metrics, ensuring leadership gains both scientific and financial visibility.
How to Analyze Data in ENT & Audiology Hospital Research & Innovation Dashboards
Here’s how hospitals can make the most of the data available on the ENT & Audiology Hospital Research & Innovation Dashboard:
- Track research activity: Use line charts to compare trends in publications and patents over time.
- Monitor project health: Analyze project status and funding utilization against targets.
- Review innovation adoption: Track how quickly research outcomes are integrated into clinical practice.
- Evaluate the impact of collaboration: Use the collaboration index to measure partnership effectiveness.
- Assess funding efficiency: Compare R&D expenditure with outputs like patents and publications.
- Measure clinical trial progression: Monitor stages from idea to patent for significant projects.
Benefits of ENT & Audiology Hospital Research & Innovation Dashboards
Here are the benefits of implementing this ENT & Audiology Research Dashboard:
- Improved research visibility: Real-time KPIs across projects, publications, patents, and funding.
- Enhanced innovation tracking: Monitors adoption rates and clinical implementation of research.
- Funding performance tracking: Links R&D spending to outcomes such as patents and publications.
- Evidence-based decision-making: Helps justify investments in research and technology.
- Collaboration optimization: Tracks the impact of partnerships through collaboration scores.
- Compliance & reporting: Works as an ENT & audiology research reporting and compliance dashboard for audits and grant reporting.
Together, these elements provide leadership with scientific and financial visibility, making it easier to align research efforts with hospital goals. That’s why many healthcare leaders call it the best research dashboard for ENT & audiology hospitals when scaling innovation and academic impact.
KPIs to Track in ENT & Audiology Hospital Research & Innovation Dashboards
- Active Research Projects: Current and year-over-year growth.
- Publications Count: Peer-reviewed articles in ENT and audiology.
- Patent Applications: Intellectual property filings and grants.
- R&D Expenditure (%): Investment in research as a percentage of the budget.
- Collaboration Index: Score reflecting internal and external partnerships.
- Innovation Adoption Rate (%): How quickly research is applied clinically.
- Funding Utilization (%): Efficiency of grant and fund usage.
- Clinical Trial Progression: Stages from idea to patent.
Frequently Asked Questions
1. Who should use an ENT & Audiology Hospital Research & Innovation Dashboard?
Research directors, chief innovation officers, hospital CEOs, and grant managers responsible for research strategy and performance monitoring.
2. Can this dashboard help improve research funding efficiency?
Yes. Leadership can make better investment decisions by linking R&D expenditure to outputs like patents and publications.
3. Is this dashboard useful for compliance?
Yes, because an ENT & audiology research workflow and outcome analytics dashboard supports governance, grant reporting, and compliance audits.