
What is an Electric Power Transmission Center Grid Operations & Load Flow Dashboard?
An Electric Power Transmission Center Grid Operations & Load Flow Dashboard is a specialized analytics platform designed for transmission system operators (TSOs) to monitor, analyze, and optimize grid performance. It integrates load flow analysis, grid stability metrics, cross-border power exchanges, and outage data into a single interface, enabling operators to maintain reliable, efficient, and secure power transmission. This dashboard provides historical insights into system load trends, congestion levels, frequency deviations, and unplanned outages, helping TSOs prevent blackouts, reduce operational costs, and improve grid resilience. By visualizing power flow patterns, interconnection utilization, and operational reserve margins, utilities can make data-driven decisions to balance supply and demand, optimize transmission capacity, and comply with regulatory standards.
How to Create an Electric Power Transmission Center Grid Operations & Load Flow Dashboard
You don’t need to build your report from scratch, just start with a ready-to-use dashboard template from Mokkup. Add in your data and export it however you like. Here’s how to do it:
1. Create or Log in to Your Mokkup Account
Start by signing up on Mokkup.ai using your email. If you already have an account, just log in, and you’ll be good to go.
2. Choose and Customize Your Dashboard Template
Find the Electric Power Transmission Center Grid Operations & Load Flow Dashboard template in the Templates section. Use the drag-and-drop editor to adjust KPIs, edit filters, or add elements based on your data.
3. Export to Your BI Tool
Once your dashboard wireframe is ready, use the BI Tool Export feature to send it directly to Power BI or Tableau for further analysis and enhancements. You can also download the dashboard as a PDF, PNG, or JPEG, embed it on a platform, or invite your team to collaborate.
Note: This is a Pro template. You’ll need a Pro subscription on Mokkup to use and customize this dashboard wireframe. Upgrade anytime to unlock full access.
Electric Power Transmission Center Grid Operations & Load Flow Dashboard Example
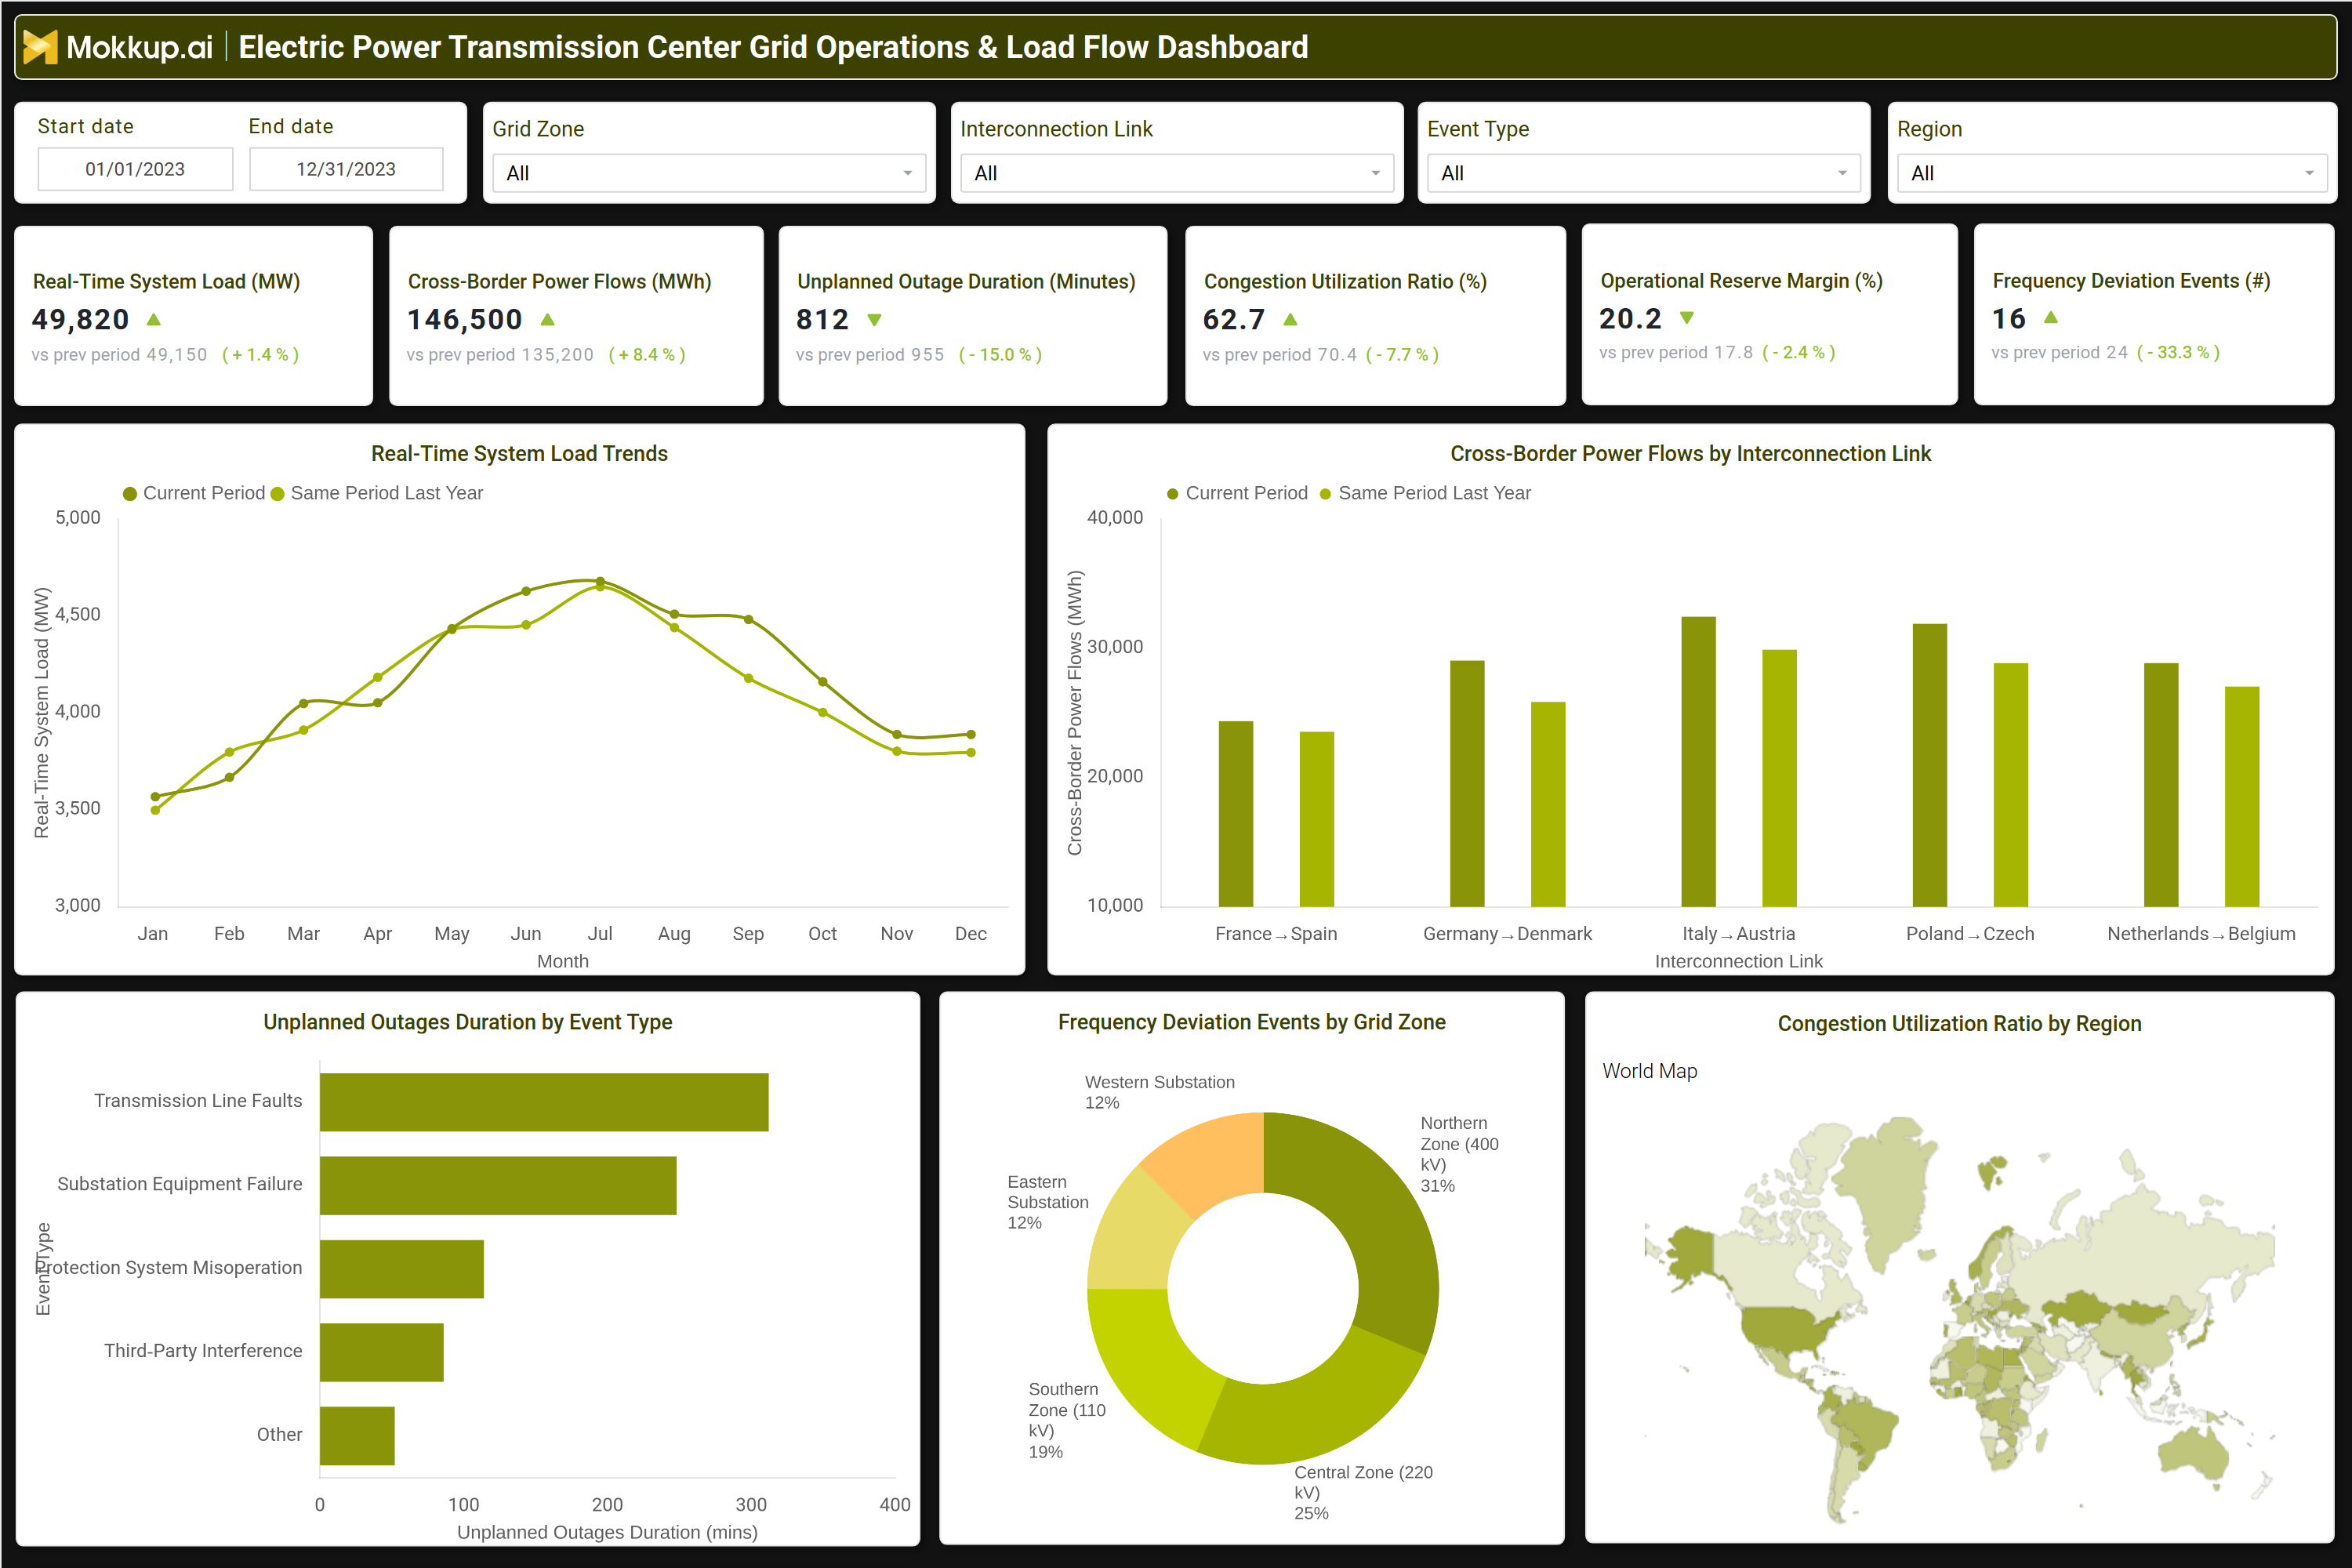
A typical TSO grid operations dashboard includes interactive filters for date ranges, grid zones, interconnection links, event types, and regions, allowing operators to drill down into specific performance metrics. Key KPI tiles display real-time system load (MW), cross-border power flows (MWh), unplanned outage duration (minutes), congestion utilization ratio, operational reserve margin, and frequency deviation events . Trend charts compare current system load against the previous year, while bar graphs break down cross-border power flows by interconnection link (e.g., France-Spain, Germany-Denmark). A horizontal bar chart tracks unplanned outages by event type (transmission line faults, substation failures, and third-party interference), and a pie chart visualizes frequency deviation events by grid zone. A world map highlights congestion utilization ratios by region, providing a geospatial view of grid stress points. Together, these components form a comprehensive grid monitoring solution that helps TSOs detect inefficiencies, predict failures, and optimize transmission networks.
How to Analyze Data in an Electric Power Transmission Center Grid Operations & Load Flow Dashboard
Here is how you can analyze data from this dashboard:
- Monitor real-time system load trends to detect demand spikes and adjust generation accordingly.
- Track cross-border power flows to identify interconnection bottlenecks and optimize energy trading.
- Analyze unplanned outage durations to assess grid reliability and prioritize maintenance.
- Evaluate congestion utilization ratios to determine transmission line capacity constraints.
- Review operational reserve margins to ensure grid stability during peak demand.
- Assess frequency deviation events to detect grid instability and prevent blackouts.
- Compare current performance with historical data to identify long term trends and anomalies.
- Use geospatial maps to visualize regional congestion and outage patterns.
Benefits of an Electric Power Transmission Center Grid Operations & Load Flow Dashboard
The following are the benefits of using this cross‑border energy flow dashboard:
- Enhances Grid Reliability: Detects transmission inefficiencies early and helps operators address issues before they cause disruptions, ensuring a more stable and reliable power grid.
- Optimizes Power Flow: Uses load flow analysis tools to manage electricity distribution efficiently across the transmission network.
- Reduces Congestion Costs: Identifies transmission bottlenecks and enables operators to resolve them, minimizing congestion-related costs.
- Improves Operational Decision-Making: Provides real-time grid monitoring insights that help operators make faster and more informed decisions.
- Supports Regulatory Compliance: Ensures grid performance monitoring and reporting align with regulatory and industry standards.
- Enables Predictive Maintenance: Tracks outages and equipment issues to help operators anticipate failures and schedule maintenance in advance.
- Facilitates Cross-Border Energy Trading: Supports international energy exchange through load management and grid operations monitoring.
- Increases Cost Efficiency: Reduces operational losses and improves asset utilization for more cost-effective grid management.
KPIs to Track in an Electric Power Transmission Center Grid Operations & Load Flow Dashboard
The following key KPIs can be tracked by using this power transmission stability analytics dashboard:
- Real-Time System Load (MW) – Measures current electricity demand on the transmission network.
- CrossBorder Power Flows (MWh) – Tracks energy exchanges between interconnected grids.
- Unplanned Outage Duration (Mins) – Indicates grid reliability by measuring unexpected downtime.
- Congestion Utilization Ratio (%) – Shows the percentage of transmission line capacity in use.
- Operational Reserve Margin (%) – Measures available backup power to prevent blackouts.
- Frequency Deviation Events (Count) – Counts instances of grid frequency instability.
Frequently Asked Questions
1. What is a transmission grid load flow dashboard used for?
It helps transmission system operators monitor power flow, grid stability, and outages to ensure reliable electricity delivery.
2. What data sources feed into a load flow TSO real‑time grid monitoring dashboard?
SCADA systems, EMS (Energy Management Systems), outage management platforms, and interconnection trading data.
3. How does electric utility congestion management dashboard improve grid efficiency?
It identifies congestion points, optimizes power routing, and reduces transmission losses.