What is an Electric Power Distribution Center Capital Projects & Grid Expansion Dashboard?
An Electric Power Distribution Utilities Capital Projects & Grid Expansion Dashboard is a centralized analytics platform that monitors infrastructure investments, grid expansion progress, and financial performance for distribution system operators (DSOs). It consolidates capital expenditure (CapEx) data, project milestones, regulatory compliance, and key performance indicators (KPIs) into a single interface.
This dashboard helps utilities track budget allocation, project delays, permit acquisition, and grid expansion efficiency to ensure timely and cost-effective infrastructure upgrades. By analyzing trends in CapEx deployment, grid modernization, and stakeholder engagement, DSOs can make data-driven decisions to improve project execution and regulatory compliance.
How to Create an Electric Power Distribution Center Procurement & Inventory Efficiency Dashboard
You don’t need to build your report from scratch, just start with a ready-to-use dashboard template from Mokkup. Add in your data and export it however you like. Here’s how to do it:
1. Create or Log in to Your Mokkup Account
Start by signing up on Mokkup.ai using your email. If you already have an account, just log in, and you’ll be good to go.
2. Choose and Customize Your Dashboard Template
Find the Electric Power Distribution Center Capital Projects & Grid Expansion Dashboard template in the Templates section. Use the drag and drop editor to adjust KPIs, edit filters, or add elements based on your data.
3. Export to Your BI Tool
Once your dashboard wireframe is ready, use the BI Tool Export feature to send it directly to Power BI or Tableau for further analysis and enhancements. You can also download the dashboard as a PDF, PNG, or JPEG, embed it on a platform, or invite your team to collaborate.
Note: This is a Pro template. You’ll need a Pro subscription on Mokkup to use and customize this dashboard wireframe. Upgrade anytime to unlock full access.
Electric Power Distribution Center Capital Projects & Grid Expansion Dashboard Example
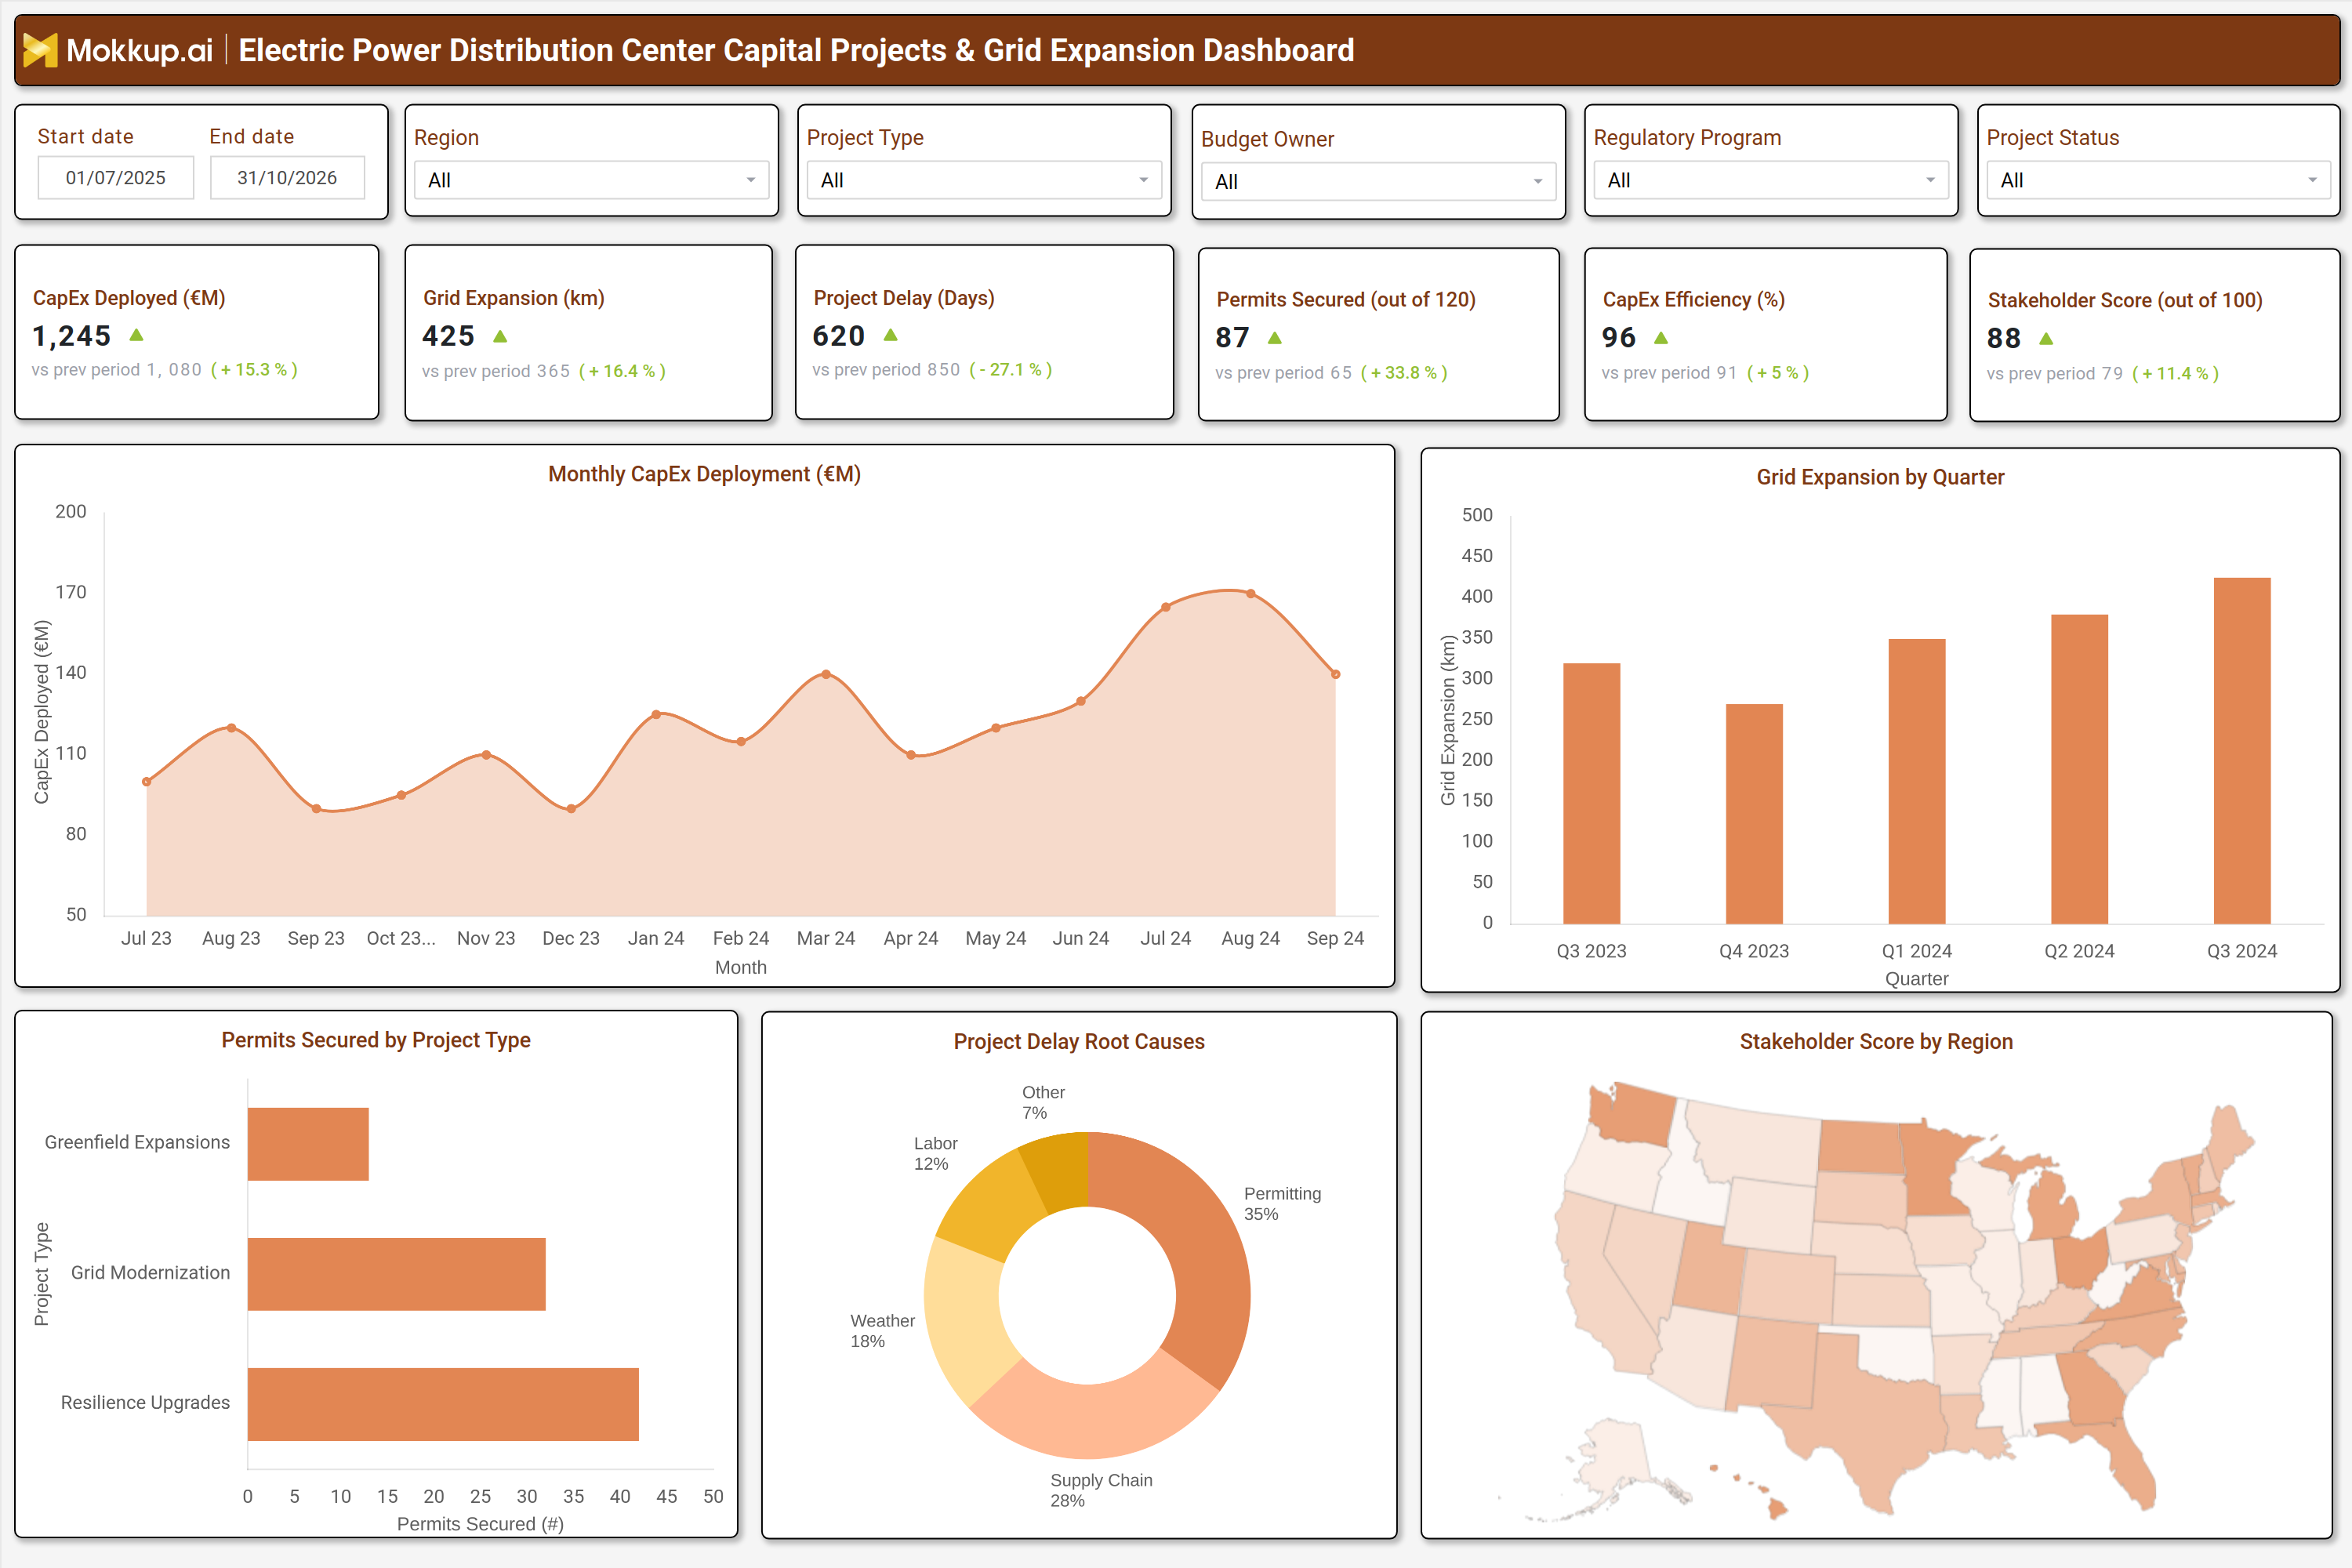
A typical utility capital expenditure dashboard for distribution networks includes interactive filters for date ranges, regions, project types, budget owners, and regulatory programs. Key metrics displayed in performance tiles include CapEx deployed, grid expansion in kilometers, project delays, permits secured, CapEx efficiency, and stakeholder scores. Trend charts show monthly CapEx deployment and quarterly grid expansion progress, while bar and pie charts break down permits secured by project type and root causes of project delays.
A geographic heatmap visualizes stakeholder engagement scores by region, helping utilities identify areas needing better community alignment. Together, these components provide a comprehensive view of capital project performance, enabling DSOs to optimize investments and accelerate grid expansion.
How to Analyze Data in an Electric Power Distribution Center Capital Projects & Grid Expansion Dashboard
Here is how you can analyze data from this DSO grid expansion planning and monitoring tools dashboard:
- Monitor CapEx deployment trends to assess budget utilization and financial efficiency.
- Track grid expansion progress in kilometers to measure infrastructure growth.
- Analyze project delays to identify bottlenecks and improve scheduling.
- Review permits secured to ensure regulatory compliance and avoid legal risks.
- Evaluate CapEx efficiency to optimize spending and resource allocation.
- Assess stakeholder engagement scores to improve community relations and project approvals.
- Compare current performance with historical data to detect improvements or declines.
- Use project type breakdowns to prioritize high-impact initiatives like grid modernization and resilience upgrades.
Benefits of an Electric Power Distribution Center Capital Projects & Grid Expansion Dashboard
The following are the benefits of using this power utility capital projects performance dashboard:
- Enhances visibility into capital project performance and grid expansion progress.
- Improves budget control by tracking CapEx deployment and efficiency.
- Reduces project delays through proactive risk identification and mitigation.
- Ensures regulatory compliance by monitoring permits and approvals.
- Optimizes grid expansion with data-driven infrastructure planning.
- Strengthens stakeholder engagement by tracking community and regulatory feedback.
- Supports strategic decision-making with trend analytics.
- Increases operational efficiency for power distribution companies.
KPIs to Track in an Electric Power Distribution Center Capital Projects & Grid Expansion Dashboard
The following key KPIs can be tracked by using this electric power distribution capital project management tracking dashboard:
- CapEx Deployed (£M) – Measures total capital expenditure allocated to grid expansion and modernization projects.
- Grid Expansion (km) – Tracks the total length of new or upgraded distribution lines.
- Project Delay (Days) – Monitors the average delay in project completion compared to scheduled timelines.
- Permits Secured (Count) – Tracks the number of regulatory and environmental permits obtained.
- CapEx Efficiency (%) – Evaluates how effectively capital is utilized in project execution.
- Stakeholder Score (out of 100) – Assesses community and regulatory engagement levels.
Frequently Asked Questions
1. How does a capital projects dashboard help electric distribution utilities?
It provides tracking of budget spending, project delays, and grid expansion progress, enabling better financial and operational control.
2. What data sources feed this grid modernization and expansion KPI tracking tool?
Financial systems, project management tools, regulatory databases, and GIS mapping platforms.
3. Who should use a DSO capital projects and grid expansion dashboard?
Utility executives, project managers, financial analysts, and regulatory compliance teams.