
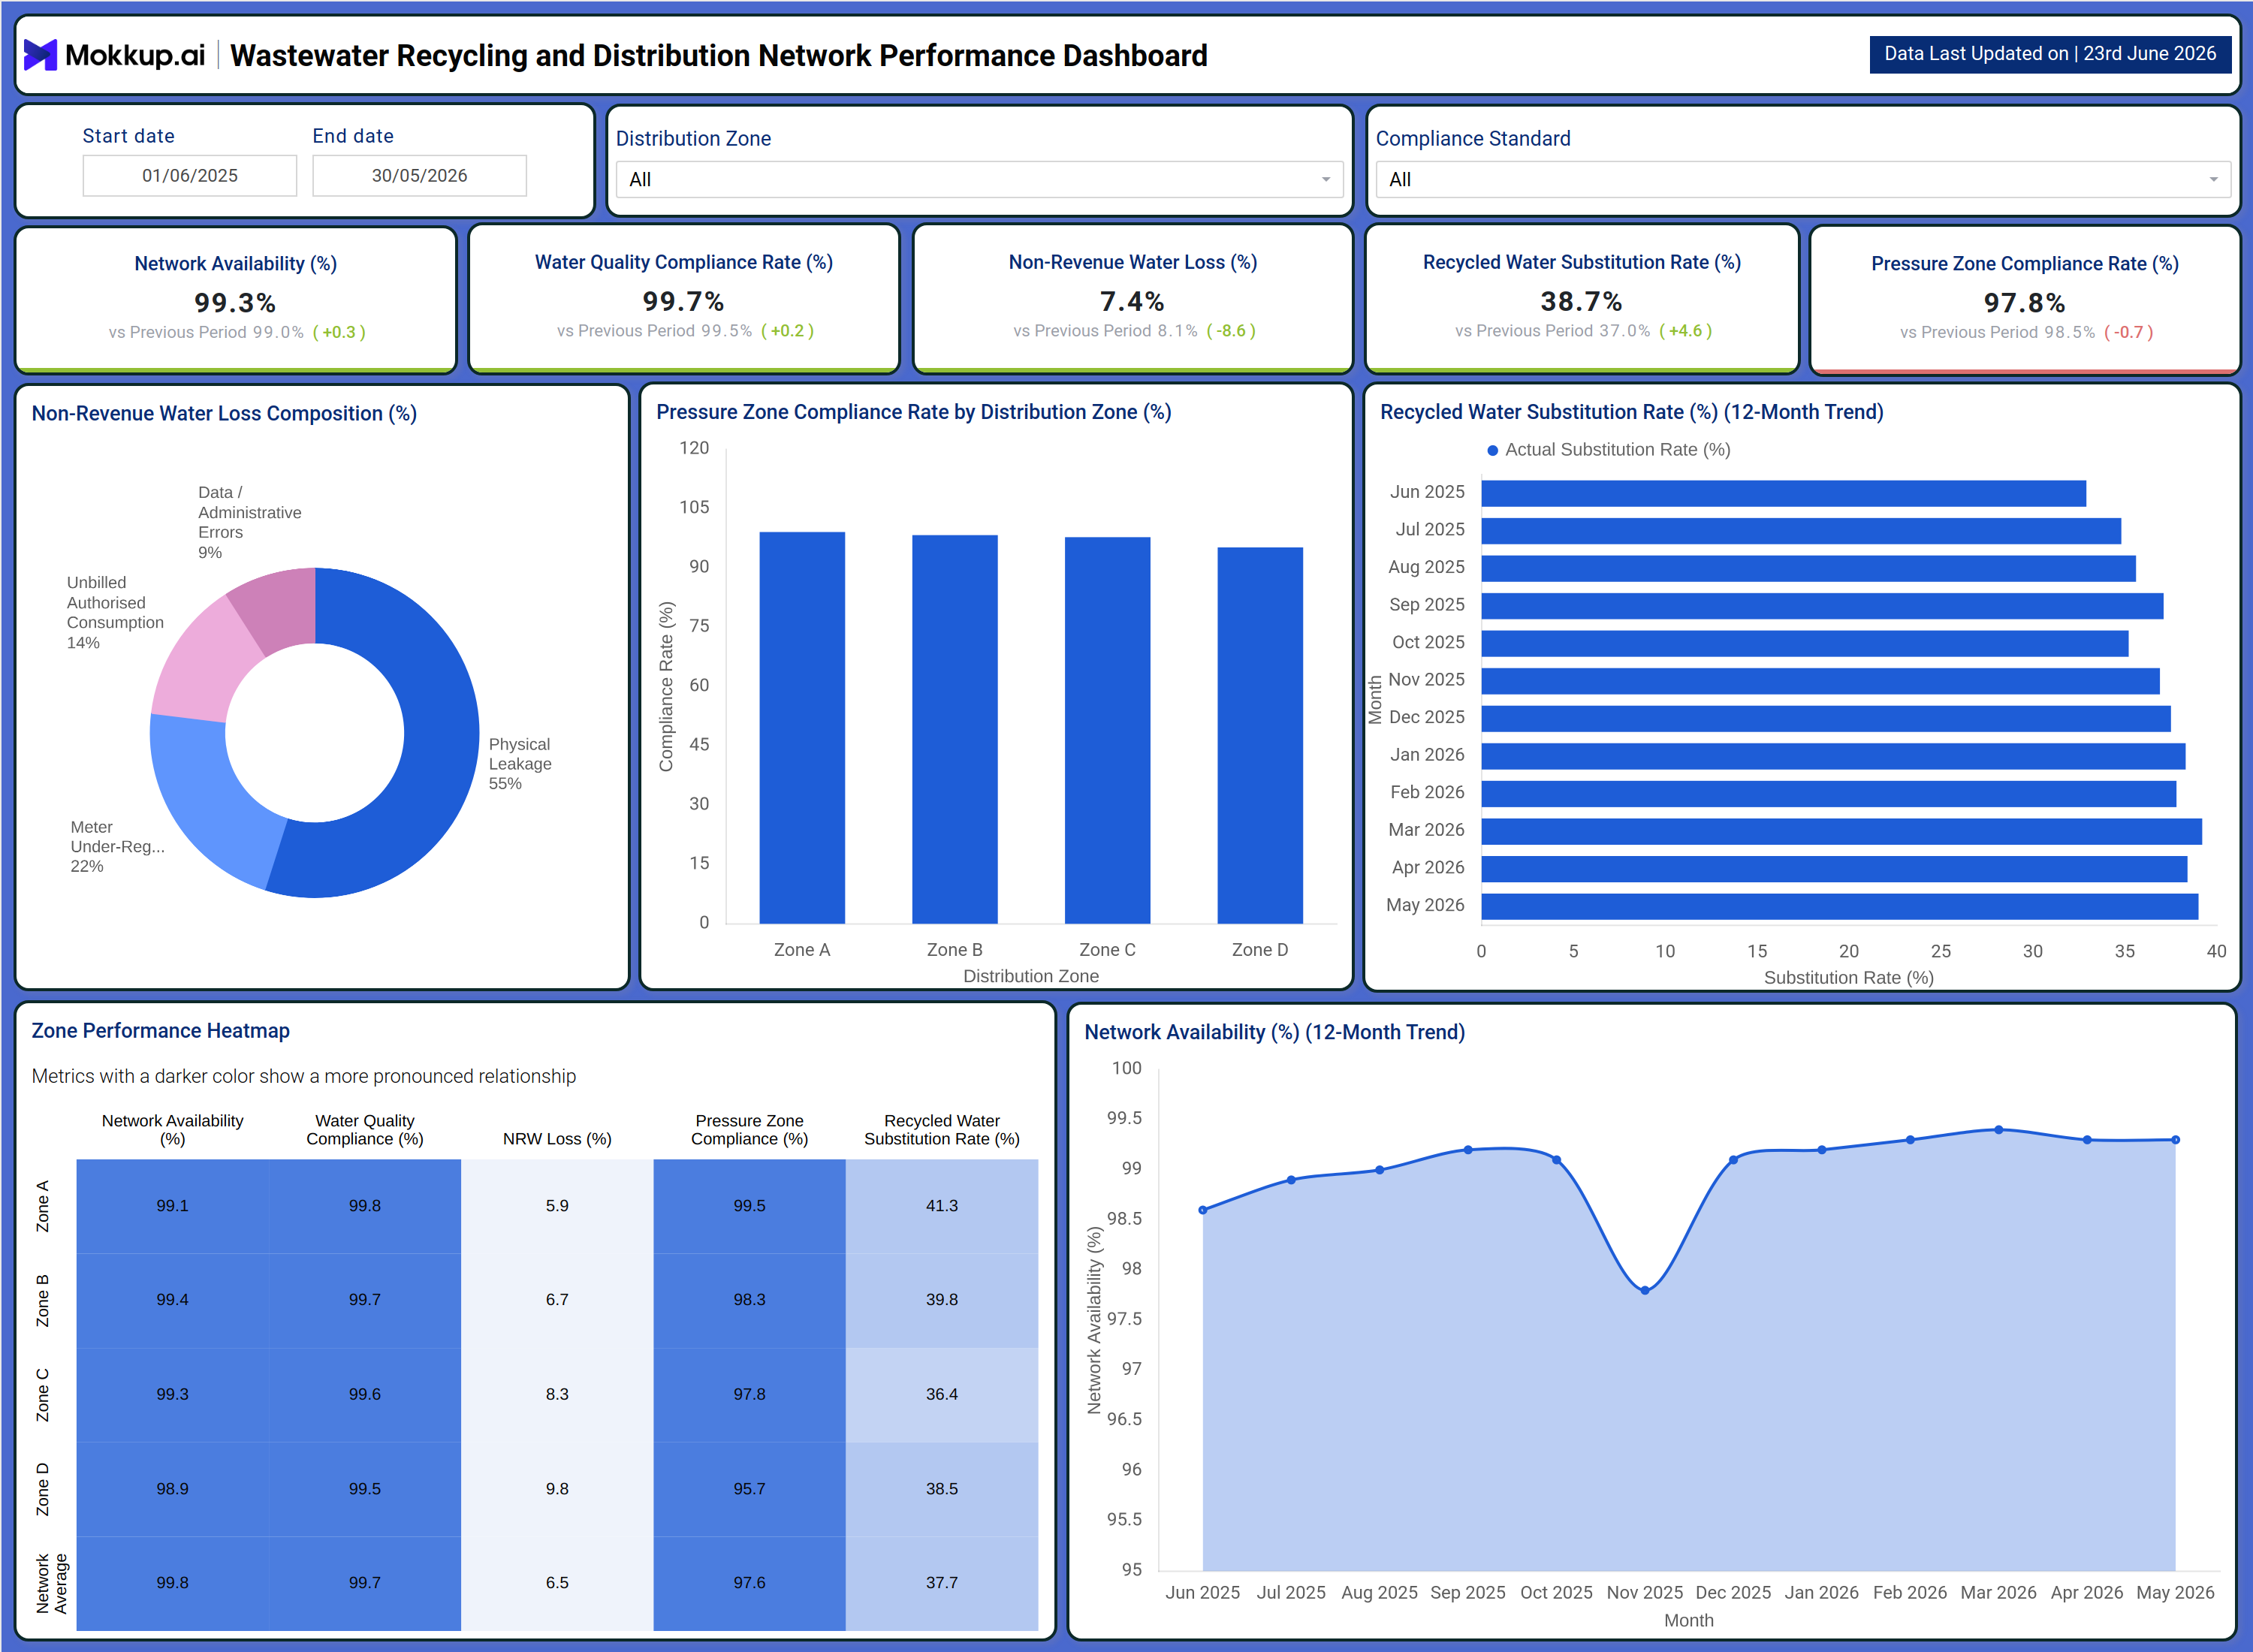
What is a Wastewater Recycling and Distribution Network Performance Dashboard?
A Wastewater Recycling and Distribution Network Performance Dashboard is a centralized reporting tool that gives water utilities, municipal operators, and infrastructure managers a complete view of how their distribution network is functioning. It consolidates metrics related to network availability, water quality compliance, non-revenue water loss, recycled water substitution, and pressure zone compliance into a single, structured interface. Operations teams use this type of wastewater network performance monitoring dashboard to track system-wide health across multiple distribution zones and identify where the network is underperforming before issues escalate. Rather than relying on disconnected reports from different departments, managers get a single source of truth that supports faster and more informed decisions. The dashboard is designed for wastewater distribution zone performance dashboard use cases that cover both current snapshots and historical trends, so teams can assess whether operational changes are producing measurable improvements over time.
How to Create a Wastewater Recycling and Distribution Network Performance Dashboard
You don't need to build your report from scratch, just start with a ready-to-use dashboard template from Mokkup. Add in your data and export it however you like. Here's how to do it:
1. Create or Log in to Your Mokkup Account
Start by signing up on Mokkup.ai using your email. If you already have an account, just log in, and you'll be good to go.
2. Choose and Customize Your Dashboard Template
Find the Wastewater Recycling and Distribution Network Performance Dashboard template in the Templates section. Use the drag-and-drop editor to adjust KPIs, edit filters, or add elements based on your data.
3. Export to Your BI Tool
Once your dashboard wireframe is ready, use the BI Tool Export feature to send it directly to Power BI or Tableau for further analysis and enhancements. You can also download the dashboard as a PDF, PNG, or JPEG, embed it on a platform, or invite your team to collaborate.
Note: This is a Pro template. You'll need a Pro subscription on Mokkup to use and customize this dashboard wireframe. Upgrade anytime to unlock full access.
Wastewater Recycling and Distribution Network Performance Dashboard Example
A regional water authority preparing for its quarterly infrastructure review opens this wastewater network performance monitoring dashboard to assess distribution network performance across all zones. The team wants to understand where recycled water substitution rates are tracking against targets, which pressure zones are showing compliance gaps, and whether non-revenue water losses have changed since operational adjustments were made in the previous quarter. Instead of compiling data from multiple systems, the entire picture is available in one view, filtered by date range, distribution zone, and compliance standard. Teams working through the dashboard can quickly identify which zones carry the highest physical leakage contribution to non-revenue water loss and analyze pressure zone management and compliance analytics across Zone A through Zone D. The 12-month trend views for both recycled water substitution and network availability give planners the historical context needed to determine whether current performance is improving or deteriorating.
The zone performance heatmap enables a wastewater distribution zone performance dashboard review that lets infrastructure managers compare each zone side by side across all key dimensions simultaneously, making cross-zone water distribution network efficiency analysis far more efficient than reviewing tabular reports independently. By combining wastewater recycling system analytics with distribution zone compliance tracking into one dashboard, utility operators can prioritize maintenance schedules, allocate resources more precisely, and build stronger evidence-based cases for capital investment. Teams responsible for regulatory reporting can extract structured performance evidence without spending time manually pulling data, while operations leads gain a clearer picture of where recycled water network compliance and pressure zone management and compliance analytics require immediate attention.
How to Analyze Data in a Wastewater Recycling and Distribution Network Performance Dashboard
Here is how you can analyze data from this dashboard:
- Use the Distribution Zone filter to isolate performance for a specific zone before drawing comparisons
- Review the Non-Revenue Water Loss Composition donut chart to identify whether losses stem from physical leakage or administrative and metering errors
- Compare the Pressure Zone Compliance Rate bar chart across zones to locate where compliance is lowest
- Use the Recycled Water Substitution Rate 12-Month Trend to assess whether substitution rates are increasing or plateauing
- Monitor the Network Availability 12-Month Trend line chart to detect operational dips tied to specific months or seasonal patterns
- Refer to the Zone Performance Heatmap to benchmark each zone against the network average across all five metrics to evaluate cross-zone water distribution network efficiency
- Apply the Compliance Standard filter to scope analysis to a specific regulatory framework when preparing audit documentation
Benefits of a Wastewater Recycling and Distribution Network Performance Dashboard
The following are the benefits of using this wastewater recycling system analytics dashboard:
- Consolidates wastewater network performance monitoring into a single operational view across all distribution zones
- Reduces time spent compiling reports by making KPIs and trend data immediately accessible to operations teams
- Supports proactive maintenance planning by surfacing leakage composition and zone compliance gaps early
- Enables infrastructure managers to compare distribution zone performance side by side without switching between tools
- Provides historical trend visibility that helps teams demonstrate measurable progress in recycled water network compliance
- Helps utility operators build evidence-based cases for capital investment with structured, auditable performance data
- Aligns cross-functional teams across operations, compliance, and planning through wastewater recycling system analytics
KPIs to Track in a Wastewater Recycling and Distribution Network Performance Dashboard
The following key KPIs can be tracked by using this recycled water network compliance tracking dashboard:
- Network Availability (%) — measures the percentage of time the distribution network is operational and available without outages or interruptions
- Water Quality Compliance Rate (%) — tracks the proportion of water quality tests or checkpoints that meet the applicable regulatory or internal compliance standard
- Non-Revenue Water Loss (%) — the percentage of water introduced into the distribution system that does not generate revenue due to physical leakage, metering errors, unbilled authorized consumption, or administrative losses
- Recycled Water Substitution Rate (%) — measures the share of total water demand met by recycled water, reflecting progress toward sustainability targets and recycled water network compliance goals
- Pressure Zone Compliance Rate (%) — the proportion of pressure zone readings that fall within the defined compliance range across each distribution zone
Frequently Asked Questions
1. What distribution zones does this dashboard support?
The wastewater distribution zone performance dashboard is built to track performance across multiple zones simultaneously and can be filtered by individual zone using the Distribution Zone selector. The Zone Performance Heatmap supports side-by-side comparison across all zones, making it straightforward to identify underperforming areas within the network.
2. Can this dashboard be used for regulatory compliance reporting?
Yes. The Compliance Standard filter allows teams to scope data to a specific regulatory framework, and KPIs like Water Quality Compliance Rate and Pressure Zone Compliance Rate are directly aligned with typical utility audit requirements. Teams focused on recycled water network compliance will find the 12-month trend views particularly useful for demonstrating measurable progress over reporting periods.
3. How does this dashboard help reduce non-revenue water loss?
By breaking NRW loss into its component sources through the Non-Revenue Water Loss Composition chart, operations teams can distinguish between physical leakage and administrative or metering issues. This breakdown, supported by wastewater recycling system analytics, directs maintenance and auditing efforts to the highest-impact areas, while pressure zone management and compliance analytics provides additional diagnostic depth across the distribution network.