What is a Digital Pathology Adoption Dashboard?
A Digital Pathology Adoption Dashboard is an analytics platform that helps pathology labs monitor their progress in transitioning from manual slide handling to digital workflows. It consolidates operational, technical, and user adoption data into a single view. This pathology lab workflow efficiency dashboard template enables IT directors and operations managers to evaluate how effectively digital systems are being used. Key metrics such as scanner utilization, slide digitization rates, and system uptime provide insight into the readiness and reliability of digital pathology infrastructure.
The dashboard wireframe helps labs identify bottlenecks, optimize digital slide workflows, and measure their return on technology investments.
How to Create a Digital Pathology Adoption Dashboard
You don’t need to build your report from scratch—just start with a ready-to-use Digital Pathology Adoption dashboard template from Mokkup. Add in your data and export it however you like. Here’s how to do it:
1. Create or Log in to Your Mokkup Account
Start by signing up on Mokkup.ai using your email. If you already have an account, just log in, and you’ll be good to go.
2. Choose and Customize Your Dashboard Template
Find the Digital Pathology Adoption Dashboard template in the Templates section. Use the drag-and-drop editor to adjust KPIs, edit filters, or add elements based on your data.
3. Export to Your BI Tool
Once your dashboard wireframe is ready, use the BI Tool Export feature to send it directly to Power BI or Tableau for further analysis and enhancements. You can also download the dashboard as a PDF, PNG, or JPEG, embed it on a platform, or invite your team to collaborate.
Note: This is a Pro template. You’ll need a Pro subscription on Mokkup to use and customize this dashboard wireframe. Upgrade anytime to unlock full access.
Digital Pathology Adoption Dashboard Example
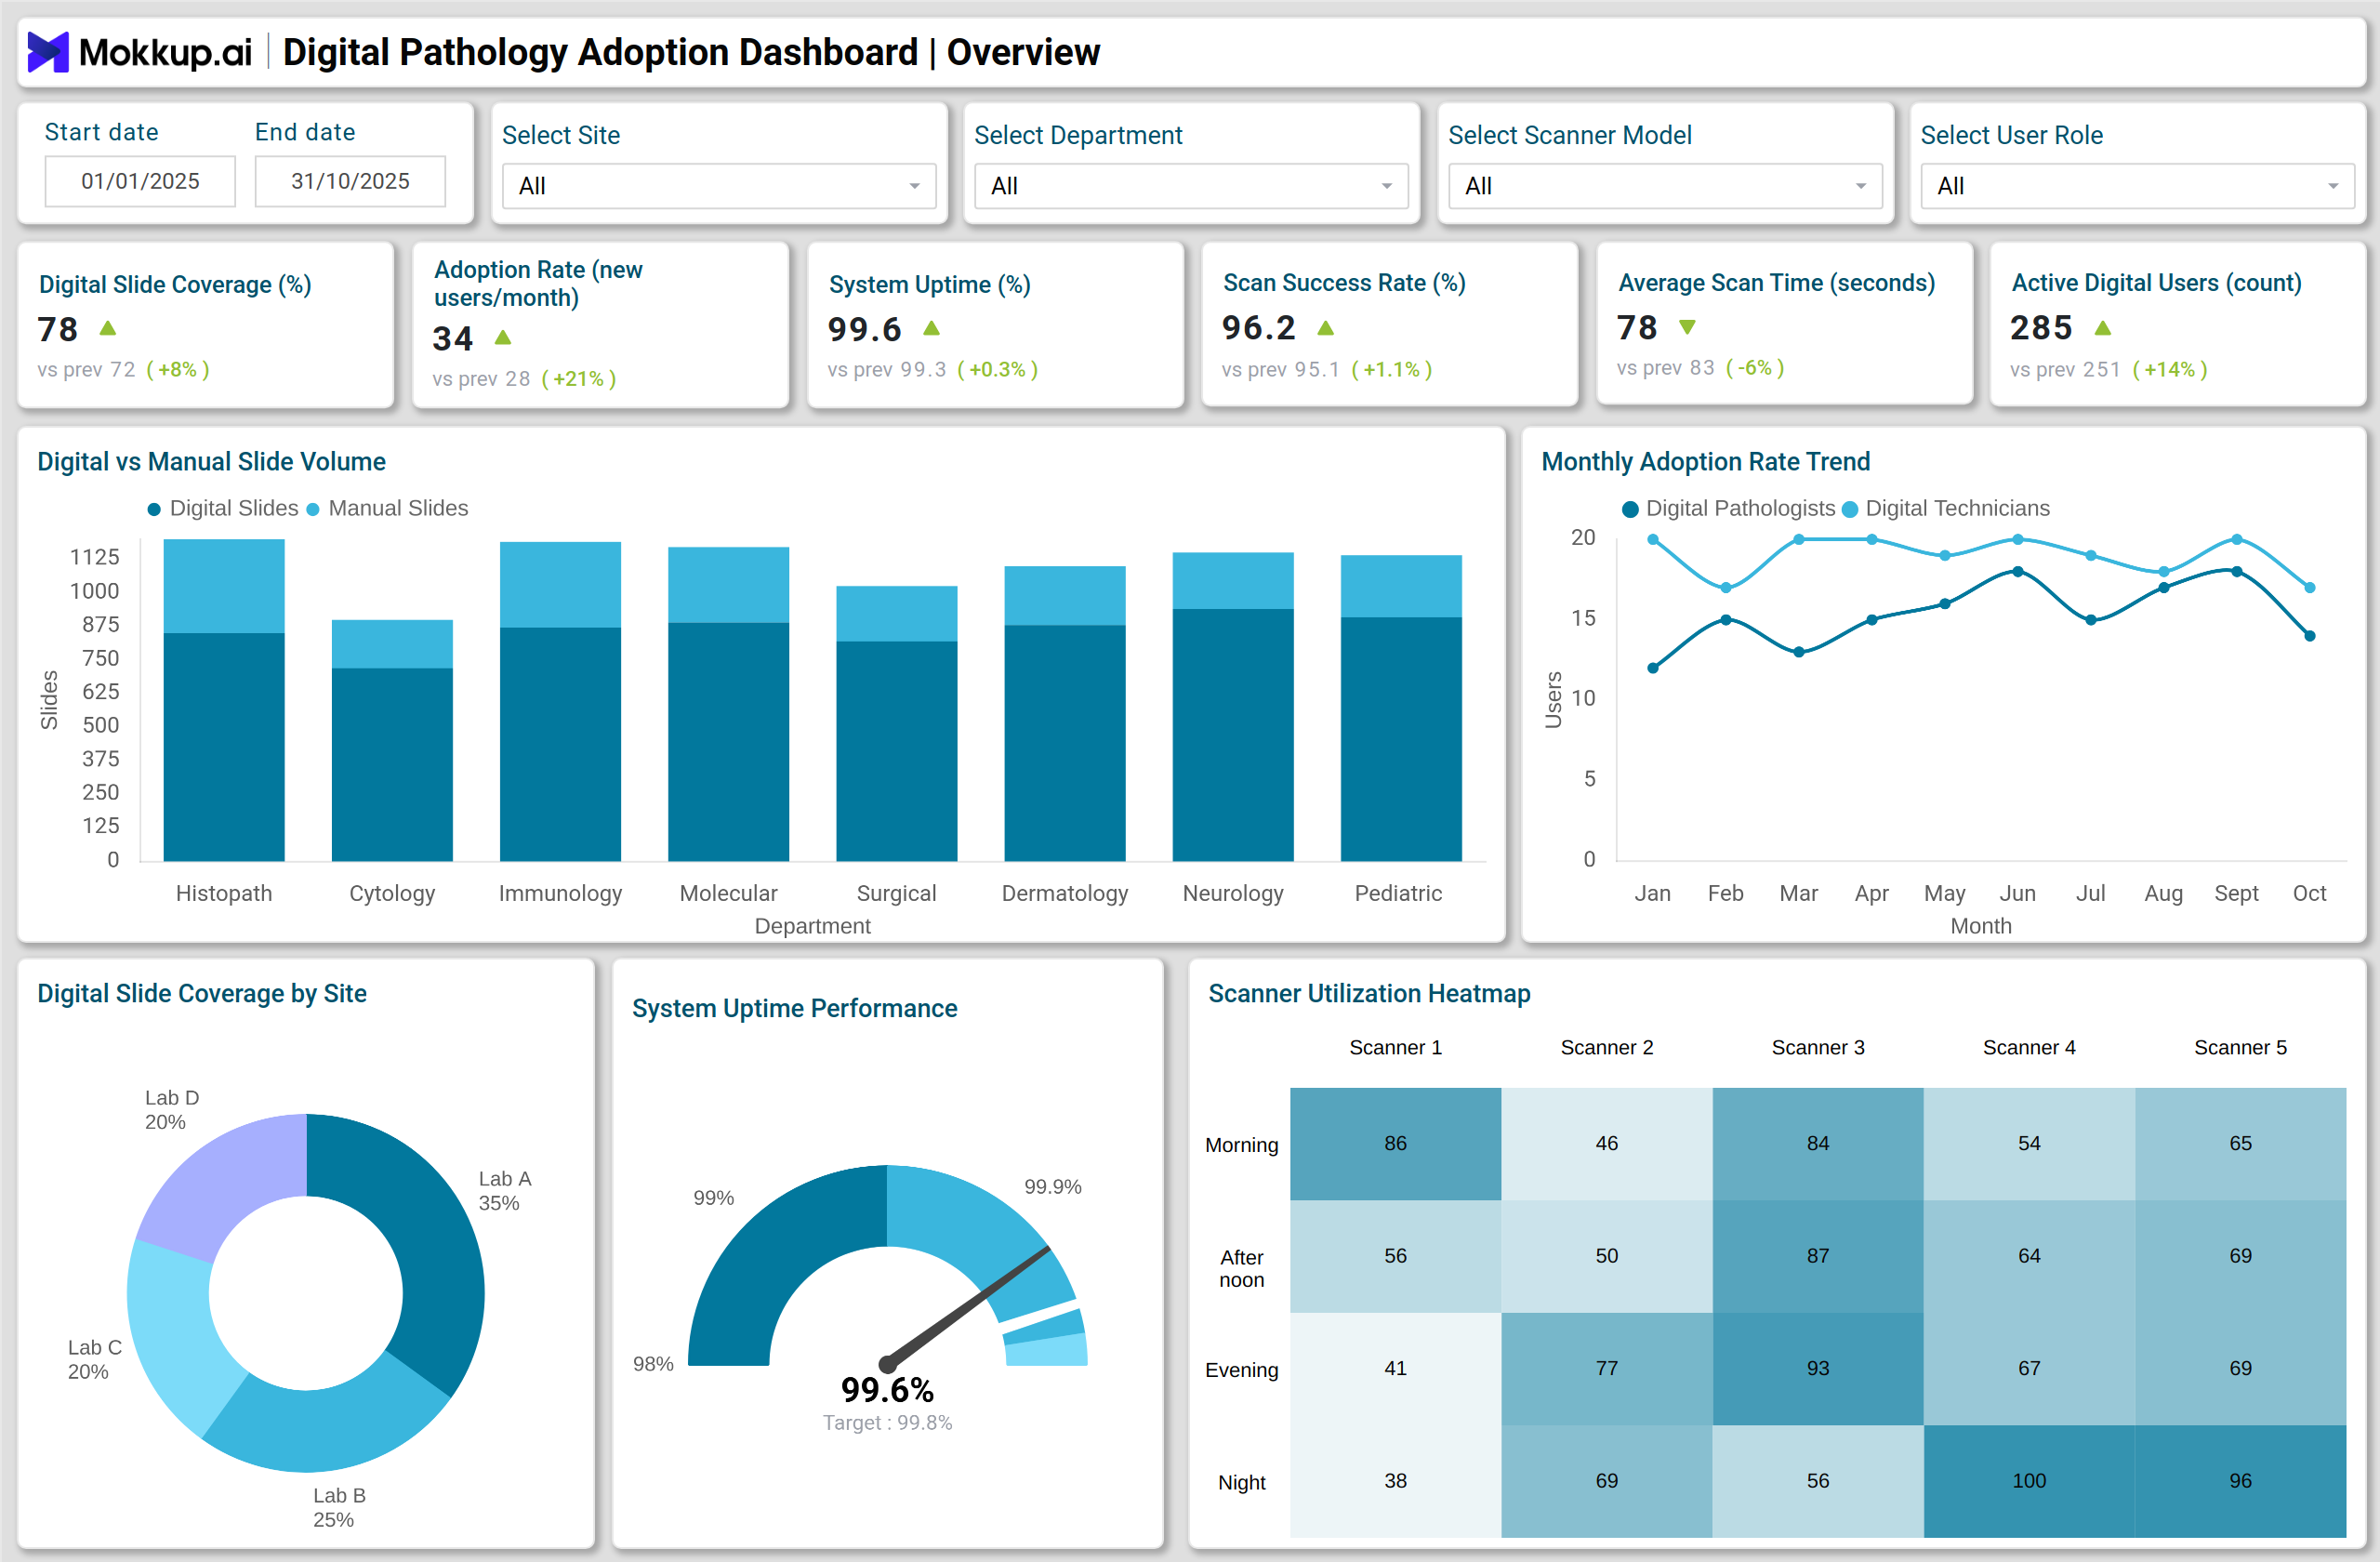
In a pathology lab, the Digital Pathology Adoption Dashboard visualizes operational and adoption metrics across multiple departments like Histopathology, Cytology, Immunohistochemistry, and Molecular diagnostics. A stacked column chart shows Digital vs Manual Slide Volume by Department, highlighting how each unit progresses in digital transformation. A line chart tracks the monthly adoption rate trend, distinguishing between newly onboarded digital pathologists and technicians. The donut chart displays digital slide coverage by site, helping lab leaders pinpoint facilities that have achieved higher digital utilization.
The gauge chart reflects system uptime performance, ensuring infrastructure reliability is consistent across all locations. Operational performance is further assessed with a heatmap of scanner utilization, revealing underused devices or inefficient shifts. A stacked bar chart categorizes helpdesk ticket volume by severity and type, while a combo chart correlates turnaround time (TAT) and validation rate, connecting diagnostic speed with accuracy. Lastly, treemap, waterfall, and area charts provide insight into storage usage, data flow bottlenecks, and system activity trends, respectively. Collectively, these visuals make the lab operations performance tracking dashboard a powerful tool for IT and operations teams to drive efficiency.
How to Analyze Data in Digital Pathology Adoption Dashboards
Digital pathology adoption dashboards help laboratories track the progress of digital transformation, monitor workflow efficiency, and ensure diagnostic quality. By analyzing adoption, system performance, and process metrics, lab administrators can optimize operations and support scalable digital pathology implementation:
- Monitor Adoption Rates: Evaluate how many new users are onboarded monthly to measure digital transformation progress.
- Track Digital Coverage: Assess the proportion of slides scanned digitally versus manually to determine workflow conversion success.
- Measure System Reliability: Use uptime and error incident data to ensure consistent scanner and software performance.
- Evaluate Process Efficiency: Analyze scan time per slide, storage growth, and TAT to identify process delays.
- Correlate Accuracy and Speed: Compare validation/concordance rates with turnaround times to ensure diagnostic quality.
- Identify Infrastructure Gaps: Review utilization and ticket trends to prioritize resource optimization and maintenance efforts.
- Audit Compliance: Use audit log volume and user activity trends to track security and operational accountability.
Benefits of Digital Pathology Adoption Dashboards
A digital pathology adoption dashboard provides centralized insights, enabling labs to improve efficiency, accuracy, and digital transformation outcomes:
- Improved Operational Visibility: Centralizes lab adoption, workflow, and performance metrics in a single dashboard.
- Faster Decision-Making: Real-time data enables quick identification of workflow inefficiencies.
- Optimized Resource Utilization: Helps balance workload across scanners, shifts, and departments.
- Enhanced Diagnostic Accuracy: Correlates speed and validation metrics for quality assurance.
- Increased System Reliability: Tracks uptime and incident patterns to maintain high availability.
- Scalable Digital Transformation: Supports multi-site adoption tracking for large healthcare organizations.
- Data-Driven Culture: Encourages continuous improvement based on quantitative performance metrics.
KPIs to Track in Digital Pathology Adoption Dashboards
Tracking these KPIs helps labs measure adoption, efficiency, and diagnostic performance:
- Digital Slide Coverage (%): Percentage of total slides digitized compared to manual slides.
- Adoption Rate (new digital users/month): Number of users adopting digital systems monthly.
- System Uptime (%): Measures infrastructure reliability and availability.
- Scan Success Rate (%): Percentage of successful scans out of total attempted.
- Average Scan Time per Slide (seconds): Time taken to digitize each slide.
- Active Digital Users (count): Total number of active digital pathologists and technicians.
- Turnaround Time (TAT, hours): Average time taken from sample receipt to result reporting.
Frequently Asked Questions
Q1. Who should use a Digital Pathology Adoption Dashboard?
IT directors, lab operations managers, and digital transformation leads in healthcare organizations use it to monitor and optimize digital pathology adoption.
Q2. How does this dashboard support pathology lab efficiency?
It combines adoption, uptime, and workflow data, helping labs detect inefficiencies and improve diagnostic turnaround times.
Q3. What are the most critical KPIs for adoption tracking?
Digital slide coverage, adoption rate, uptime, scan success, and validation rate are key indicators of successful implementation.
Q4. How often should the dashboard be reviewed?
Weekly or monthly reviews are recommended to track trends, detect anomalies, and maintain operational stability.