
What is a Dialysis Outcome Assessment Dashboard?
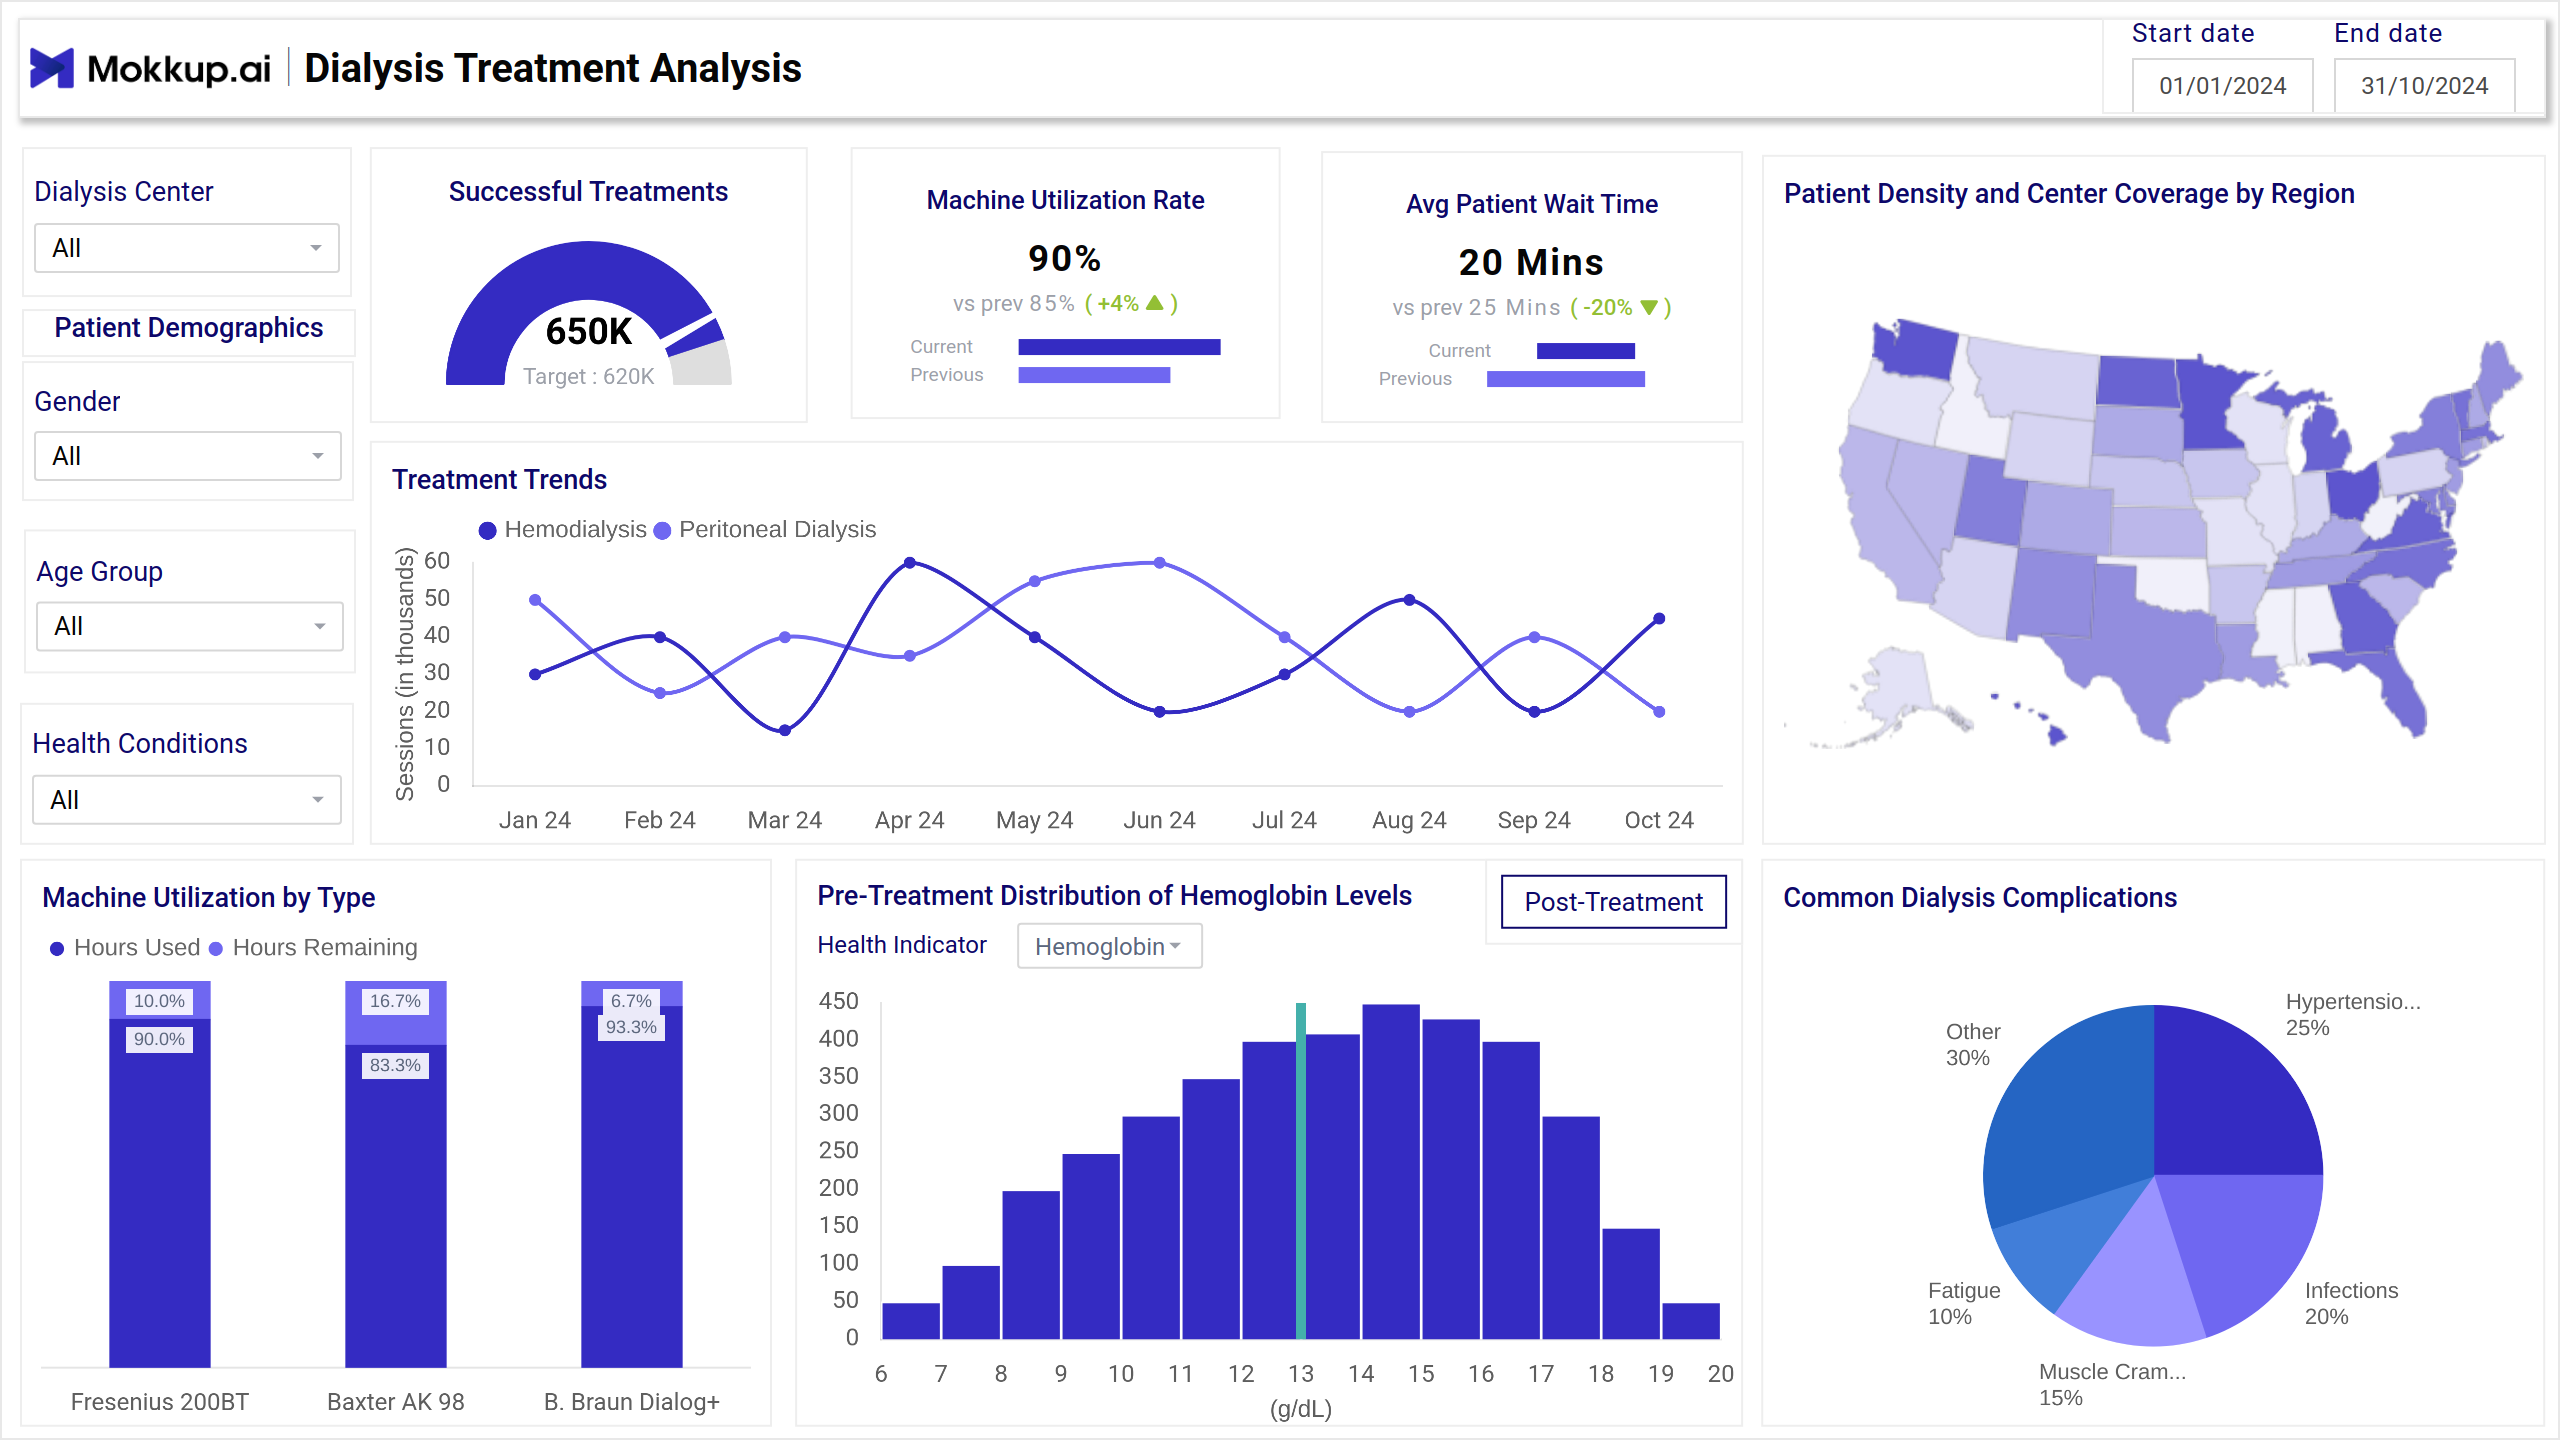
Mokkup.ai dialysis dashboard template provides a detailed view of treatment performance, patient demographics, and health outcomes for dialysis centers. This dialysis outcome dashboard is designed for healthcare administrators and practitioners, helping them track treatment trends, assess machine utilization, analyze patient health indicators, and identify common complications. It ensures data-driven decisions to optimize resource allocation and improve patient outcomes.
Dialysis Dashboard Example
You can use the renal care dashboard template to measure the effectiveness of treatment and machine utilization. The drill-down menu will give you the data points based on dialysis center and top-level tab navigation, or the sidebar layout adds to the accessibility of the dashboard. Heat maps are used to go deeper into the patient demographics. Bar charts and line charts are rightly used to identify trends and compare the clinical outcomes for effective decision-making.
How to Analyze Data in Dialysis Dashboards
Analyzing data in this dashboard wireframe is relatively easy if you fully understand why each KPI matters. Users can track data through various charts and graphs for Kidney treatment analytics, giving them an overview of machine usage, successful dialysis sessions, identifying potential service gaps, and more.
You can also see the patient imaging insights dashboard for analyzing downtimes and improving imaging performance.
How to Create a Dialysis Results Dashboard
To create a dialysis results dashboard, you can use a ready-to-use template to get started with patient dialysis monitoring. Here is what you can do:
1. Create or Log in to Your Mokkup Account
To access the dashboard templates, sign up on Mokkup.ai using your email. If you already have an account, just log in and jump right in.
2. Choose and Customize Your Health Outcome Analysis Dashboard
Head to the Templates section and select the dashboard. Use the drag-and-drop editor to modify metrics, apply demographic filters, or add elements that align with your reporting needs.
3. Export to Your BI Tool
Once your dashboard is set, use the BI Tool Export feature to move it to Power BI or Tableau for deeper insights. You can also download it as a PDF, PNG, or JPEG, embed it where needed, or share it with your team.
Note: This is a Pro template. You’ll need a Pro subscription on Mokkup to use and customize this dashboard wireframe. Upgrade anytime to unlock full access.
Benefits of Dialysis Assessment Dashboards
This dashboard template is designed to improve Treatment efficacy in dialysis, thereby focusing on improving the quality of care. Here are a few benefits:
- Visual KPIs and trends help clinicians and admins make informed choices.
- Real-time monitoring of data makes the dialysis process assessment effective.
- Early detection of patient complications ensures timely interventions.
- Provides a clear picture of treatment responses.
- Optimize machine usage, staff allocation, and treatment scheduling.
KPIs to Track in Dialysis Dashboards
In this dialysis KPI tracker, you will see the following metrics:
- Successful Treatments: Measures the percentage of dialysis sessions completed without complications.
- Machine Utilization Rate: Tracks the percentage of machine time used relative to available hours.
- Average Patient Wait Time: It calculates the average waiting period for patients before starting treatment.
- Patient Density and Centre Coverage by Region: Visualizes patient-to-center ratios across states.
- Pre-treatment Distribution of Hemoglobin Levels: Analyzes hemoglobin distribution among patients before treatment.
Frequently Asked Questions
1. How does the dashboard help improve patient outcomes?
Care teams can intervene proactively by identifying early warning signs, monitoring treatment adequacy, and spotting trends in complications or missed sessions.
2. Can I export or share reports from the dashboard?
Yes. Users can typically export visuals and data summaries in formats like PDF, Excel, or share links with their team.