What is a Dialysis Center Patient Care & Quality Dashboard?
A Dialysis Center Patient Care & Quality Dashboard is a centralized tool designed for dialysis center leadership to monitor clinical performance and care quality in real time, including clinical directors, nursing managers, and operations heads. It provides visibility into treatment efficiency, patient outcomes, infection control, staff performance, and patient satisfaction. Unlike static reports, this dashboard acts as a real-time dialysis center quality dashboard, helping institutions track adherence to clinical standards, patient retention, and operational effectiveness in one place.
How to Create a Dialysis Center Patient Care & Quality Dashboard
You don’t need to build your report from scratch—just start with a ready-to-use Dialysis Center Patient Care & Quality Dashboard template from Mokkup. Add in your data and export it however you like. Here’s how to do it:
1. Create or Log in to Your Mokkup Account
Start by signing up on Mokkup.ai using your email. If you already have an account, just log in, and you’ll be good to go.
2. Choose and Customize Your Dashboard Template
Find the Dialysis Center Patient Care & Quality Dashboard template in the Templates section. Use the drag-and-drop editor to adjust KPIs, edit filters, or add elements based on your data.
3. Export to Your BI Tool
Once your dashboard wireframe is ready, use the BI Tool Export feature to send it directly to Power BI or Tableau for further analysis and enhancements. You can also download the dashboard as a PDF, PNG, or JPEG, embed it on a platform, or invite your team to collaborate.
Note: This is a Pro template. You’ll need a Pro subscription on Mokkup to use and customize this dashboard wireframe. Upgrade anytime to unlock full access.
Dialysis Center Patient Care & Quality Dashboard Example
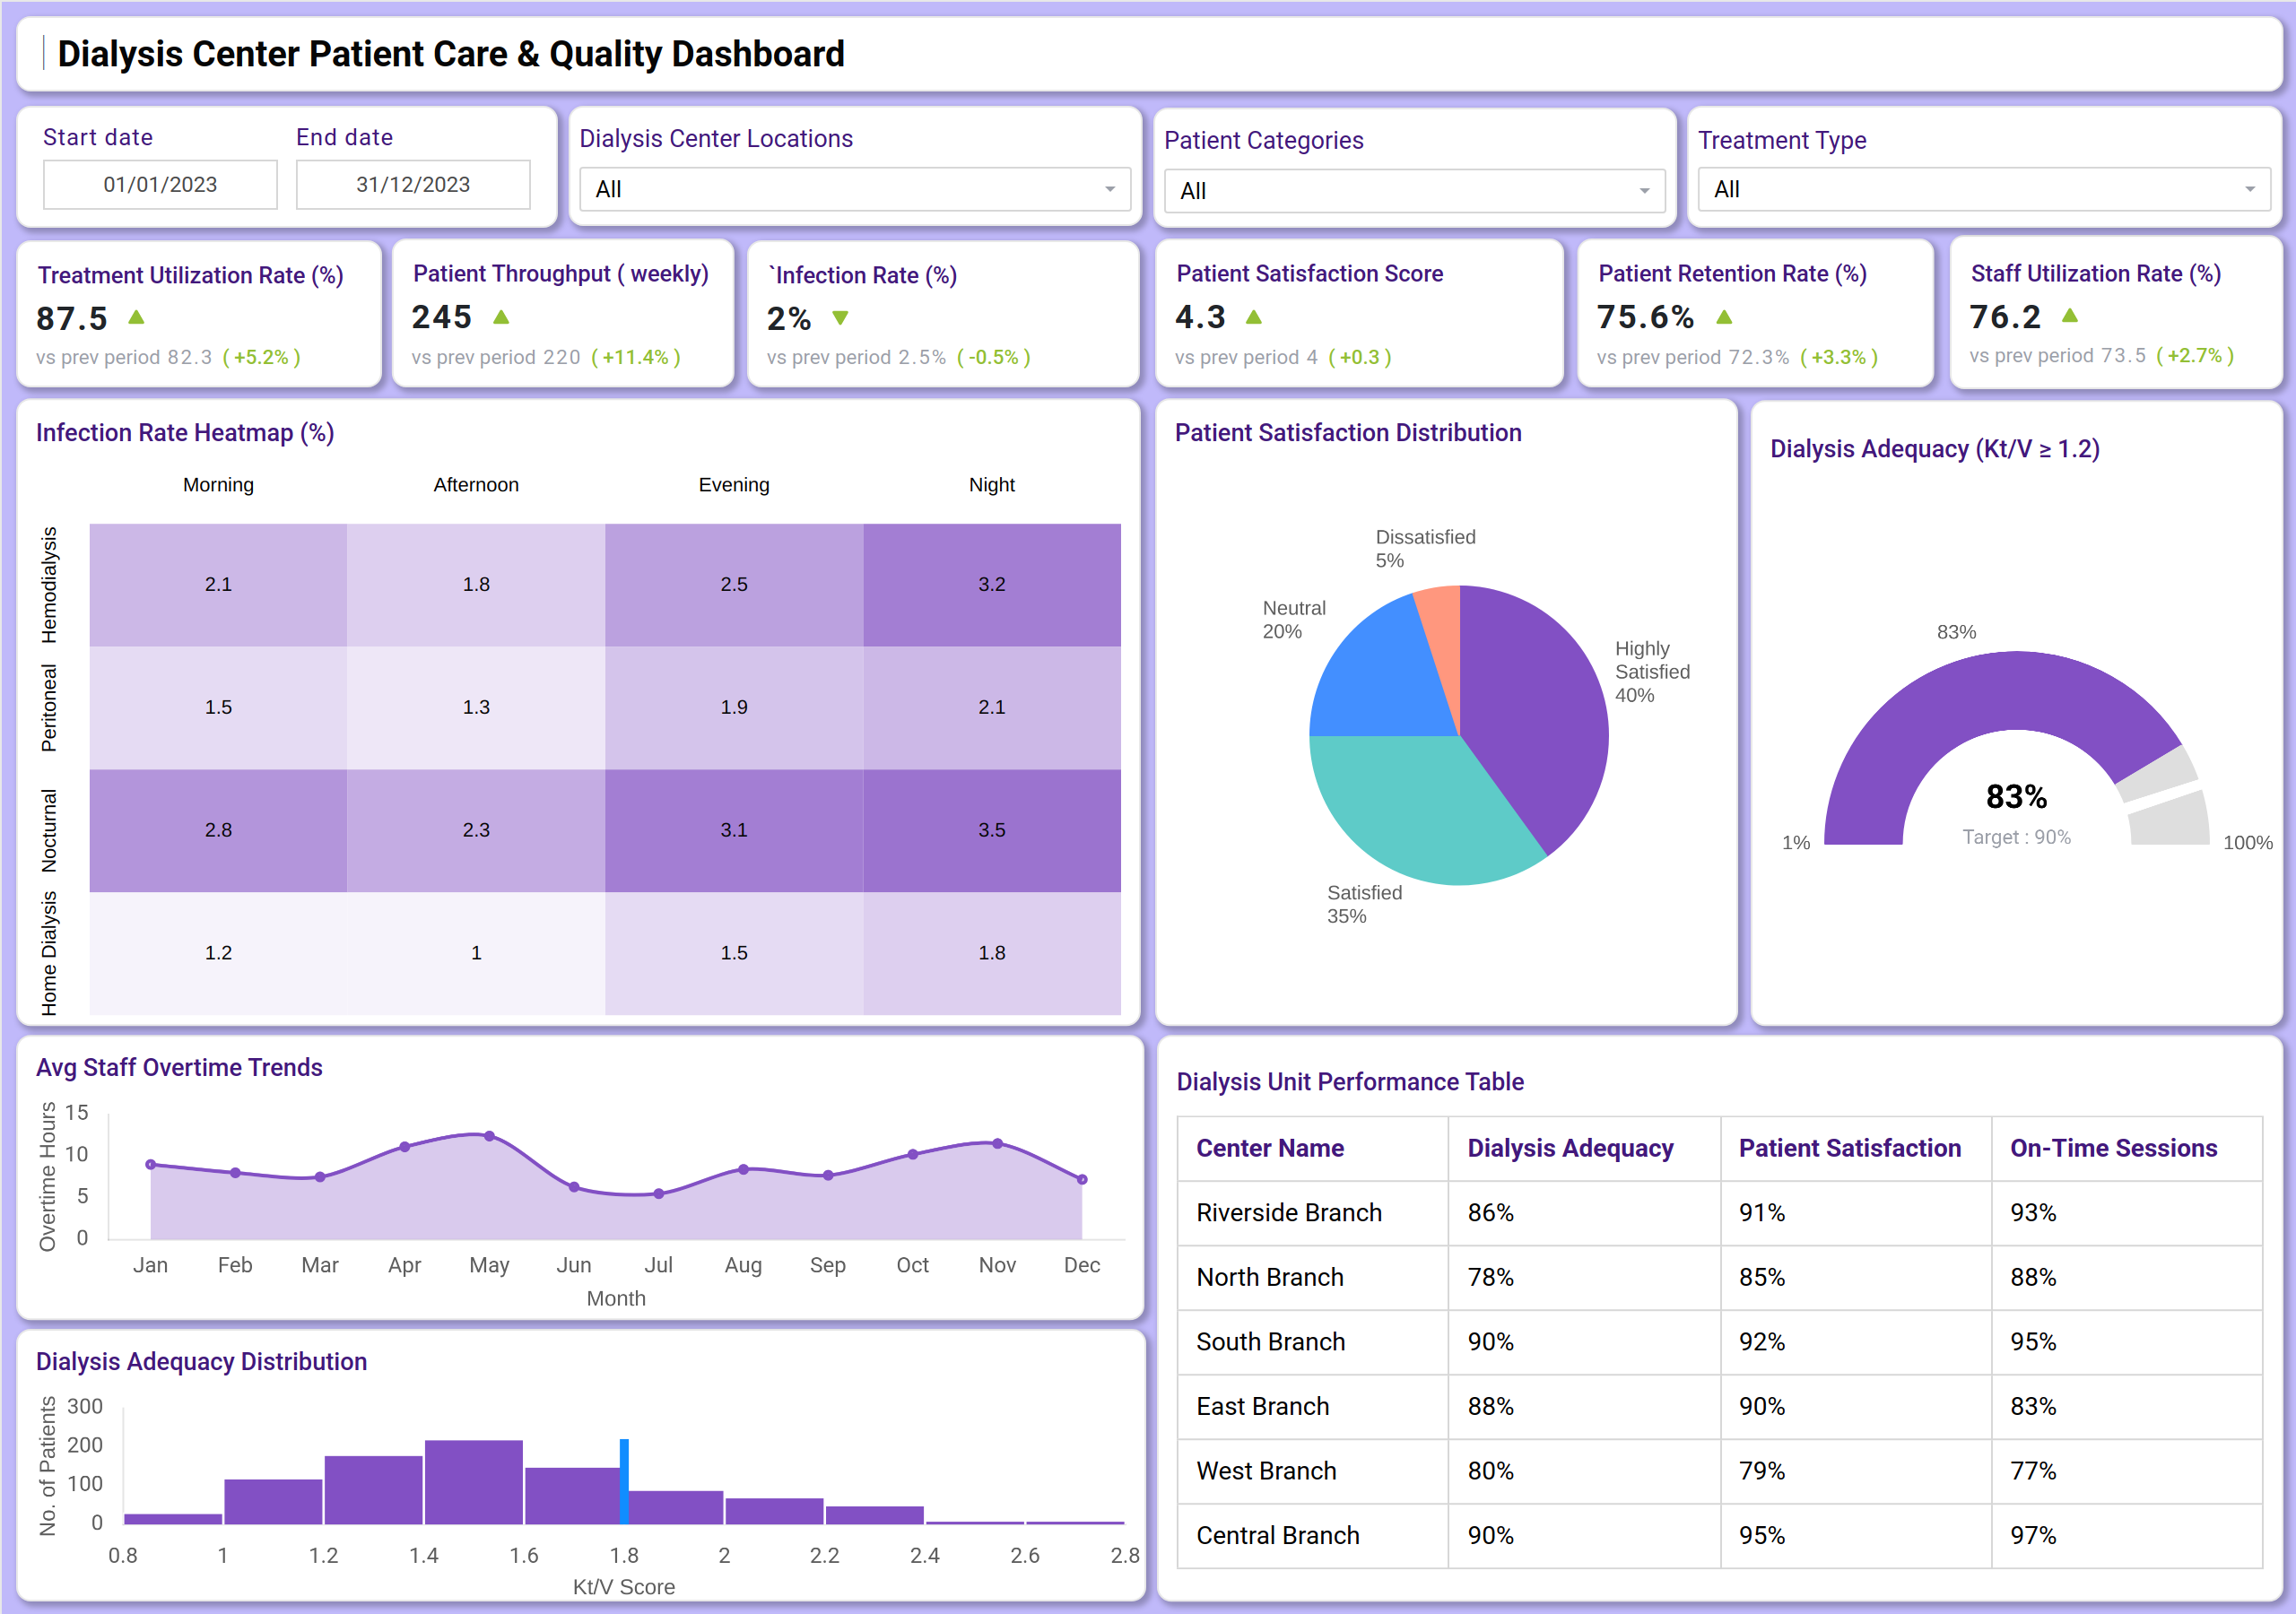
You can create a Dialysis Center Patient Care & Quality Dashboard with a mix of KPI tiles and visualizations. At the top, KPI cards track key metrics, including Treatment Utilization Rate, Patient Throughput, Infection Rate, Patient Satisfaction, and Staff Utilization. Below that, charts display infection rate trends across various intervals and shifts, patient satisfaction distribution, and dialysis adequacy (Kt/V) distribution within the patient population. A performance table helps compare key metrics, such as Dialysis Adequacy and On-Time Sessions, across different center branches. Together, this dashboard serves as the best tool for tracking dialysis center quality, ensuring leadership gains both clinical and operational visibility.
How to Analyze Data in Dialysis Center Patient Care & Quality Dashboards
Here’s how dialysis centers can make the most of the data available on the Dialysis Center Patient Care & Quality Dashboard:
- Track treatment efficiency: Monitor Treatment Utilization Rate and Patient Throughput to gauge operational capacity and flow.
- Monitor clinical quality: Analyze the Infection Rate meticulously across different shifts and intervals to identify risk patterns.
- Review patient adherence: Track Dialysis Adequacy (Kt/V) against the clinical target (e.g., ≥1.2) to ensure effective treatments.
- Evaluate patient loyalty: Connect Patient Satisfaction Scores with Patient Retention Rates to understand the patient experience.
- Assess staff workload: Monitor Staff Utilization and Overtime Trends to optimize scheduling and prevent burnout.
- Compare branch performance: Use the performance table to benchmark all center locations on key clinical and satisfaction metrics.
Benefits of Dialysis Center Patient Care & Quality Dashboards
- Improved clinical visibility: Real-time KPIs across treatment quality, patient safety, and staff performance.
- Enhanced patient outcomes: Tracks Dialysis Adequacy and Infection Rates, directly linking to patient health.
- Operational efficiency: Monitors throughput and staff utilization for better resource allocation and scheduling.
- Increased patient retention: Connects satisfaction scores with retention rates to improve loyalty and care continuity.
- Evidence-based compliance: Works as a dialysis quality reporting and compliance dashboard for audits and adherence to clinical standards.
- Proactive risk management: Identifies trends in infection rates and staff overtime, allowing for early intervention.
Together, these elements provide leadership with a comprehensive view of clinical performance and patient care, making aligning operations with positive patient outcomes easier. That’s why many clinical leaders call it the best dashboard for tracking dialysis center quality when scaling efficiency and patient care.
KPIs to Track in Dialysis Center Patient Care & Quality Dashboards
- Treatment Utilization Rate (%): Efficiency of center resource usage.
- Patient Throughput (count): Number of patients served.
- Infection Rate (%): Critical patient safety and quality indicator.
- Patient Satisfaction Score: Direct feedback on patient experience.
- Patient Retention Rate (%): Measure of patient loyalty and care continuity.
- Staff Utilization Rate (%): Efficiency of staff deployment.
- Dialysis Adequacy (Kt/V ≥ 1.2): Clinical measure of treatment effectiveness.
- On-Time Sessions (%): Operational reliability of treatments.
Frequently Asked Questions
1. Who should use a Dialysis Center Patient Care & Quality Dashboard?
Clinical directors, nursing managers, and operations heads are responsible for monitoring dialysis center performance, patient safety, and quality of care.
2. Can this dashboard help improve patient outcomes?
Yes. By tracking key clinical metrics, such as dialysis adequacy and Infection Rates, leadership can intervene proactively to maintain high standards of care.
3. How does it support operational efficiency?
It combines patient throughput and staff utilization data with treatment efficiency metrics to optimize scheduling and resource allocation.
4. Is this dashboard useful for compliance?
Yes, because a dialysis quality and patient care workflow dashboard supports governance, clinical reporting, and compliance with healthcare regulations and audits.