What is a Urology Diagnostics & Imaging Dashboard?
A Diagnostics & Imaging Dashboard for urology centers is a centralized platform designed to monitor, analyze, and visualize diagnostic imaging workflows in healthcare facilities. It consolidates data from multiple imaging modalities such as CT, MRI, ultrasound, and X-ray, enabling clinical directors, radiologists, and operations managers to make informed decisions. By tracking key performance indicators (KPIs) like study volume, exam throughput, equipment utilization, and report turnaround times, the dashboard provides a real-time view of operational efficiency.
This type of imaging performance dashboard in healthcare ensures imaging departments maintain high standards of diagnostic accuracy, patient safety, and workflow efficiency. It enables teams to identify bottlenecks, reduce repeat imaging, and optimize resources, thereby directly improving patient outcomes.
A well-designed healthcare diagnostics data visualization platform also enables stakeholders to quickly identify trends, compare performance across radiologists or modalities, and effectively implement corrective measures. By integrating a urology diagnostic study tracking dashboard, teams can monitor both clinical and operational data in a single interface.
How to Create a Urology Diagnostics & Imaging Dashboard
You don’t need to build your report from scratch—just start with a ready-to-use dashboard template from Mokkup. Add in your data and export it however you like. Here’s how to do it:
1. Create or Log in to Your Mokkup Account
Start by signing up on Mokkup.ai using your email. If you already have an account, just log in, and you’ll be good to go.
2. Choose and Customize Your Dashboard Template
Find the Urology Diagnostics & Imaging Dashboard template in the Templates section. Use the drag-and-drop editor to adjust KPIs, edit filters, or add elements based on your data.
3. Export to Your BI Tool
Once your dashboard wireframe is ready, use the BI Tool Export feature to send it directly to Power BI or Tableau for further analysis and enhancements. You can also download the dashboard as a PDF, PNG, or JPEG, embed it on a platform, or invite your team to collaborate.
Note: This is a Pro template. You’ll need a Pro subscription on Mokkup to use and customize this dashboard wireframe. Upgrade anytime to unlock full access.
Urology Diagnostics & Imaging Dashboard Example
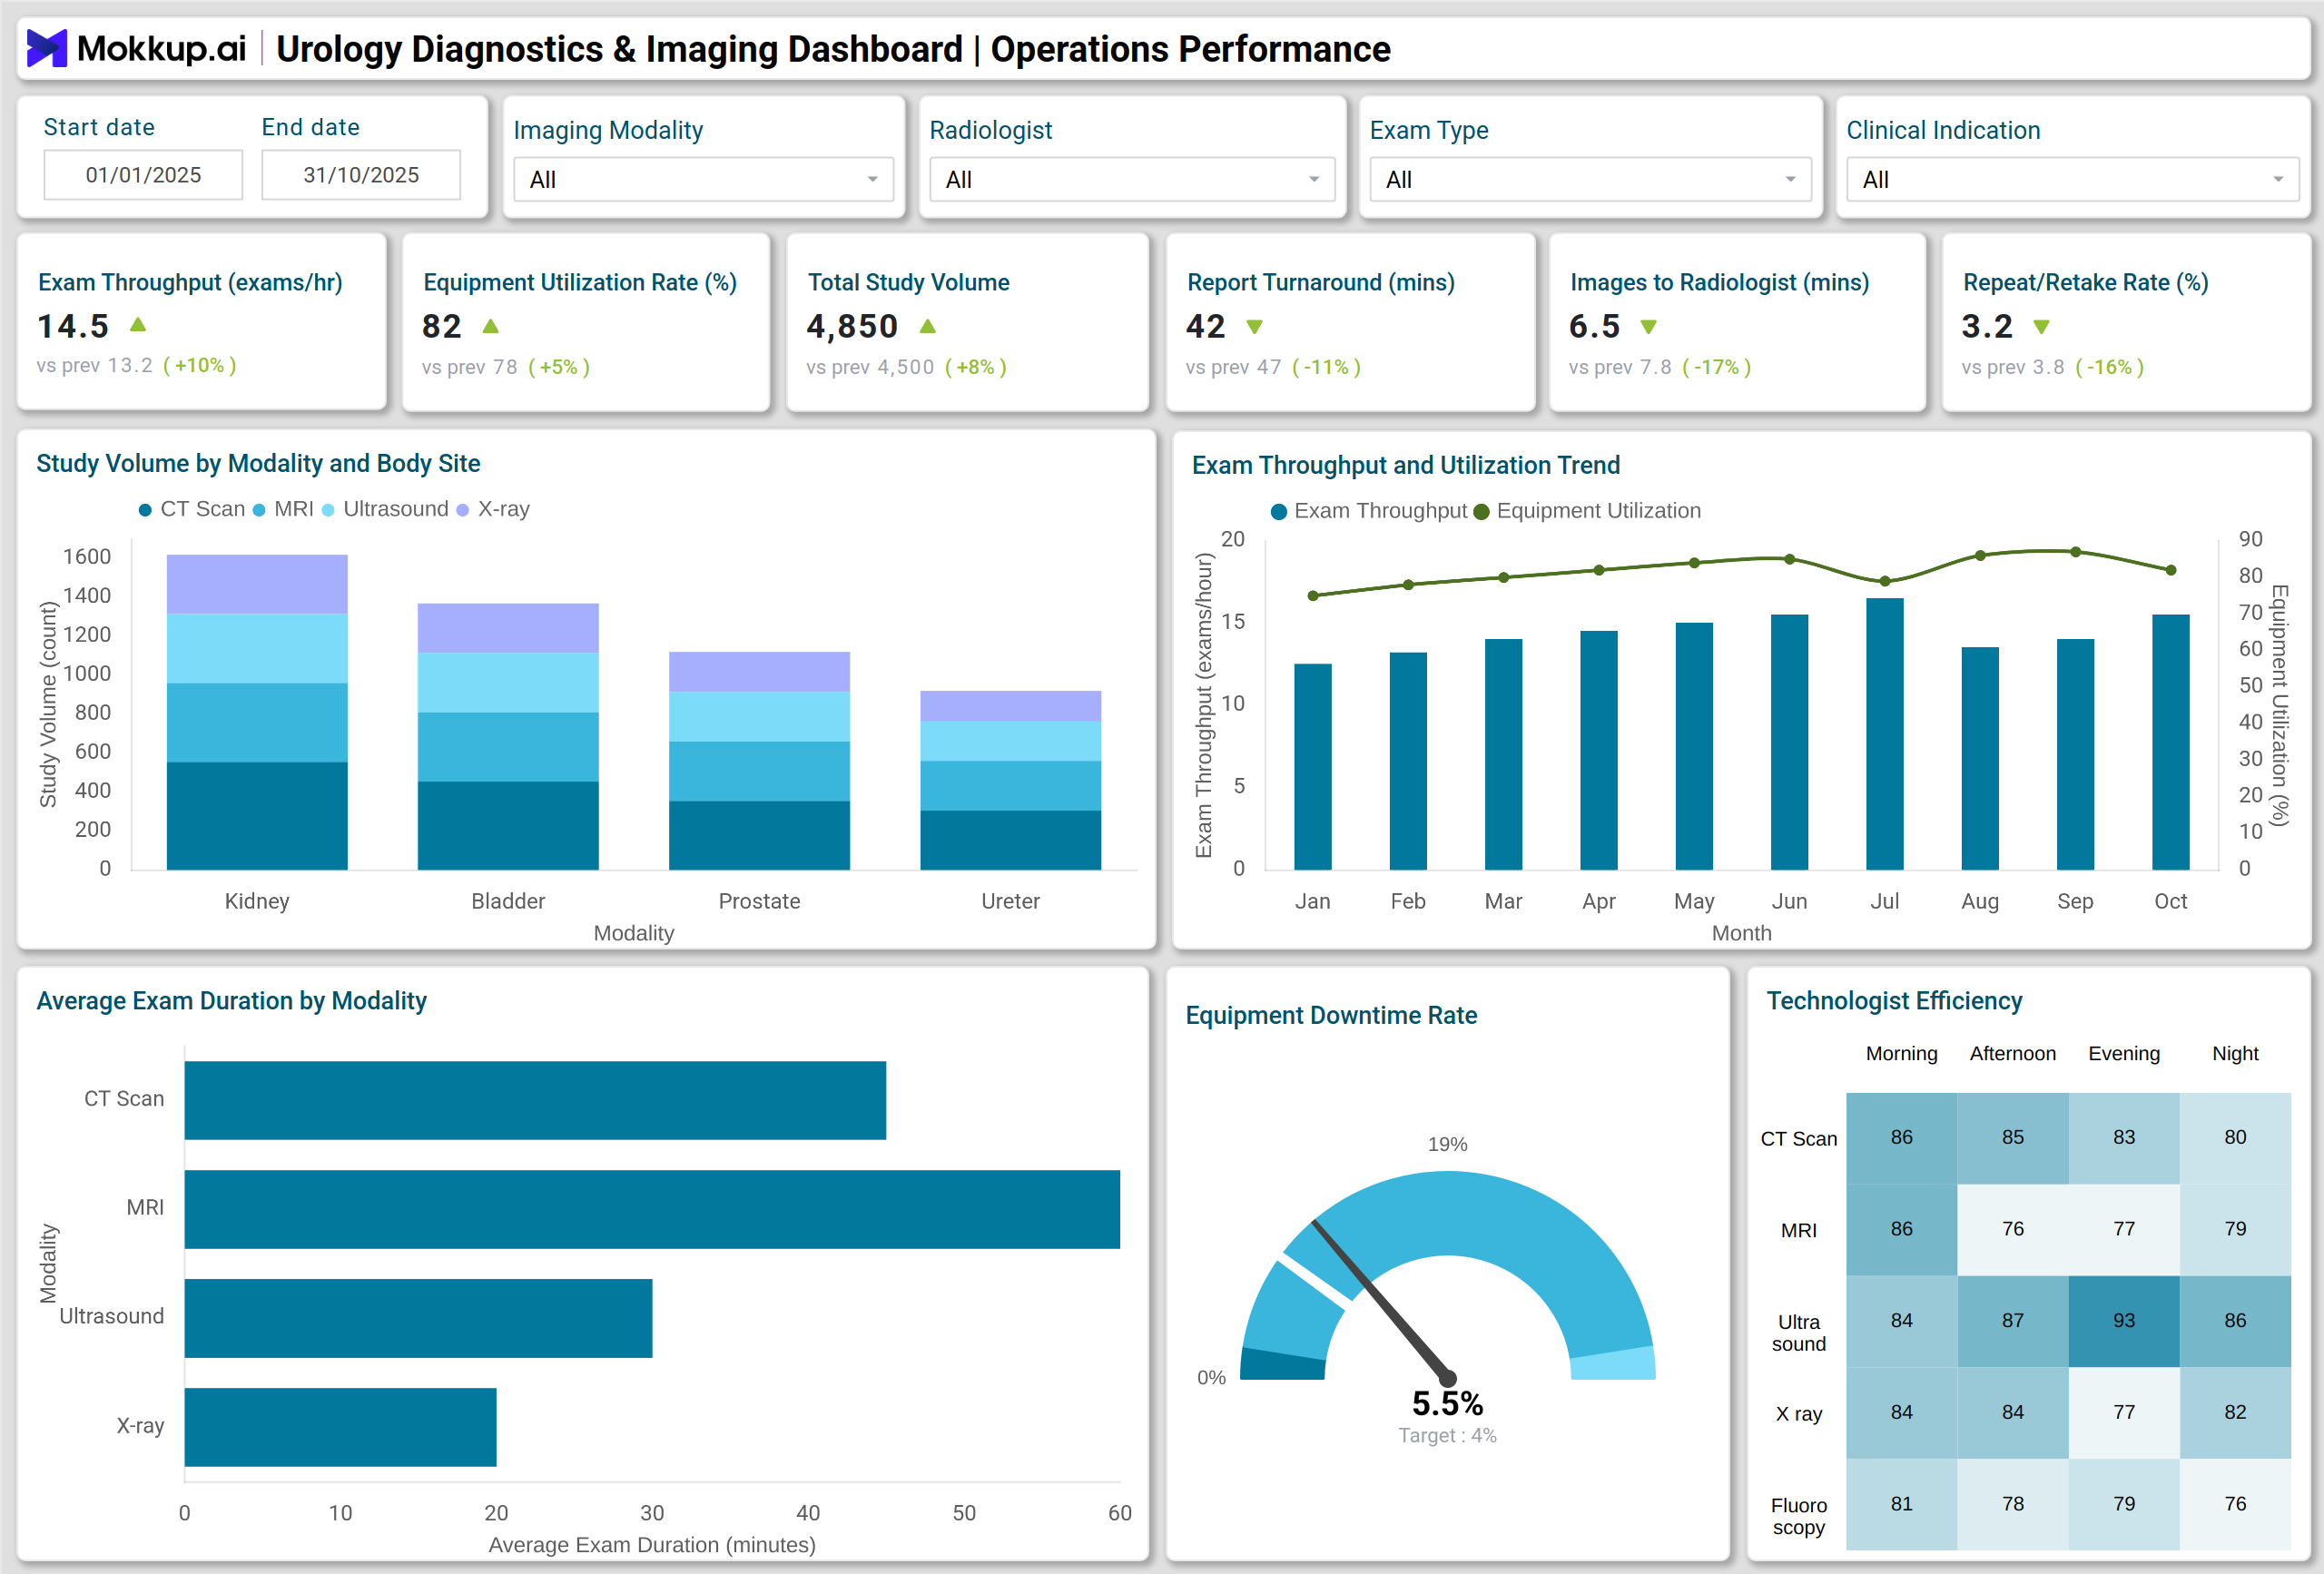
A practical urology center imaging metrics dashboard example would include a comprehensive overview of imaging operations over a year. Stacked column charts for study volume by modality and body site highlight the most frequently used imaging types. Line charts tracking exam throughput and equipment utilization trends help managers monitor productivity.
Additional visualizations, such as heatmaps for technologist productivity by shift and modality, gauge charts for equipment downtime, and donut charts showing diagnostic yield by indication, provide actionable insights. Advanced dashboards incorporate treemaps and waterfall charts for image quality audit results, maintaining high standards of diagnostic accuracy and reducing repeat/retake rates.
By using clinical imaging analytics for hospitals, urology centers can evaluate performance across multiple KPIs, detect trends in imaging quality, and implement targeted improvements to enhance patient care.
How to Analyze Data in Urology Diagnostics & Imaging Dashboards
The Diagnostics dashboard for urology centers will analyze data in the following way:
- Track exam throughput and equipment utilization trends on a monthly basis to identify capacity gaps.
- Monitor study volume by modality and body site to optimize scheduling and resources.
- Evaluate average report turnaround time and the time images are available to radiologists for workflow efficiency.
- Analyze the repeat/retake rate and image quality scores to identify areas requiring quality improvement.
- Compare diagnostic yield and imaging-driven treatment changes to assess clinical impact.
- Review radiologist report accuracy and audit rates to ensure adherence to clinical standards.
- Track average radiation dose trends to ensure compliance with patient safety guidelines.
- Utilize healthcare diagnostics data visualization to interpret complex datasets quickly.
Benefits of Urology Diagnostics & Imaging Dashboards
- Enhanced Operational Efficiency: Optimize exam throughput, reduce downtime, and streamline workflows using a urology diagnostic study tracking dashboard.
- Improved Diagnostic Accuracy: Identify discrepancies through peer review coverage and quality audits on a clinical imaging analytics for hospitals platform.
- Resource Optimization: Maximize equipment utilization and allocate staff based on productivity insights.
- Data-Driven Decisions: Access real-time insights from an imaging performance dashboard in healthcare to guide administrative and clinical strategies.
- Patient Safety and Compliance: Monitor radiation doses, repeat scans, and image quality to ensure high patient care standards are maintained.
- Performance Benchmarking: Track KPIs against historical trends and internal benchmarks via a urology center imaging metrics dashboard.
KPIs to Track in Urology Diagnostics & Imaging Dashboards
- Exam Throughput (Exams per Hour) – Measure productivity of imaging services.
- Equipment Utilization Rate (%) – Evaluate the efficiency of machine usage.
- Study Volume (All Modalities) – Track total exams performed across modalities.
- Average Report Turnaround Time (Minutes) – Monitor speed of report delivery.
- Time Images Available to Radiologist (Minutes) – Assess readiness for diagnostic review.
- Repeat / Retake Rate (%) – Track imaging rejected and redone due to quality issues.
- Image Quality Score – Evaluate diagnostic image clarity and usability.
Frequently Asked Questions
1. Who should use a Diagnostics & Imaging Dashboard?
Radiologists, clinical directors, operations managers, and quality assurance teams in urology centers can use the dashboard to monitor performance, workflow efficiency, and diagnostic outcomes.
2. How does this dashboard improve patient care?
By tracking KPIs like diagnostic yield, report accuracy, and radiation dose, teams can reduce errors, optimize imaging schedules, and deliver faster, safer care.
3. How does it help reduce repeat imaging?
Monitoring image quality scores and retake rates highlights areas for improvement, reducing unnecessary patient exposure and operational costs.
4. Is the dashboard customizable?
Yes, it allows selection of KPIs, timeframes, and visualization types, making it adaptable to the needs of urology diagnostic study tracking dashboards.