
What is a Desalination SCADA & Automation Reliability Dashboard?
The desalination SCADA reliability dashboard is a purpose-built monitoring tool for water utility operators, plant automation engineers, and control system administrators who oversee desalination facilities. It tracks six critical performance indicators — SCADA System Uptime, Critical Alarms Active, Device Communication Success Rate, Mean Time Between Failures, Sensor Data Completeness, and PLC Communication Success — across all process zones.
By centralizing desalination plant automation monitoring into a single interface, it allows teams to detect communication failures, manage alarm loads, and maintain high availability across all control systems. Plant engineers rely on it to ensure SCADA servers, PLCs, RTUs, HMIs, and Historian systems stay responsive across Seawater Intake, Pre-Treatment, RO Train A, RO Train B, Brine Discharge, and Post-Treatment zones.
How to Create a Desalination SCADA & Automation Reliability Dashboard
You don’t need to build your report from scratch—just start with a ready-to-use Desalination SCADA & Automation Reliability dashboard template from Mokkup. Add in your data and export it however you like. Here’s how to do it:
1. Create or Log in to Your Mokkup Account
Start by signing up on Mokkup.ai using your email. If you already have an account, just log in, and you'll be good to go.
2. Choose and Customize Your Dashboard Template
Find the Desalination SCADA & Automation Reliability Dashboard template in the Templates section. Use the drag-and-drop editor to adjust KPIs, edit filters, or add elements based on your data.
3. Export to Your BI Tool
Once your dashboard wireframe is ready, use the BI Tool Export feature to send it directly to Power BI or Tableau for further analysis and enhancements. You can also download the dashboard as a PDF, PNG, or JPEG, embed it on a platform, or invite your team to collaborate.
Note: This is a Pro template. You'll need a Pro subscription on Mokkup to use and customize this dashboard wireframe. Upgrade anytime to unlock full access.
Desalination SCADA & Automation Reliability Dashboard Example
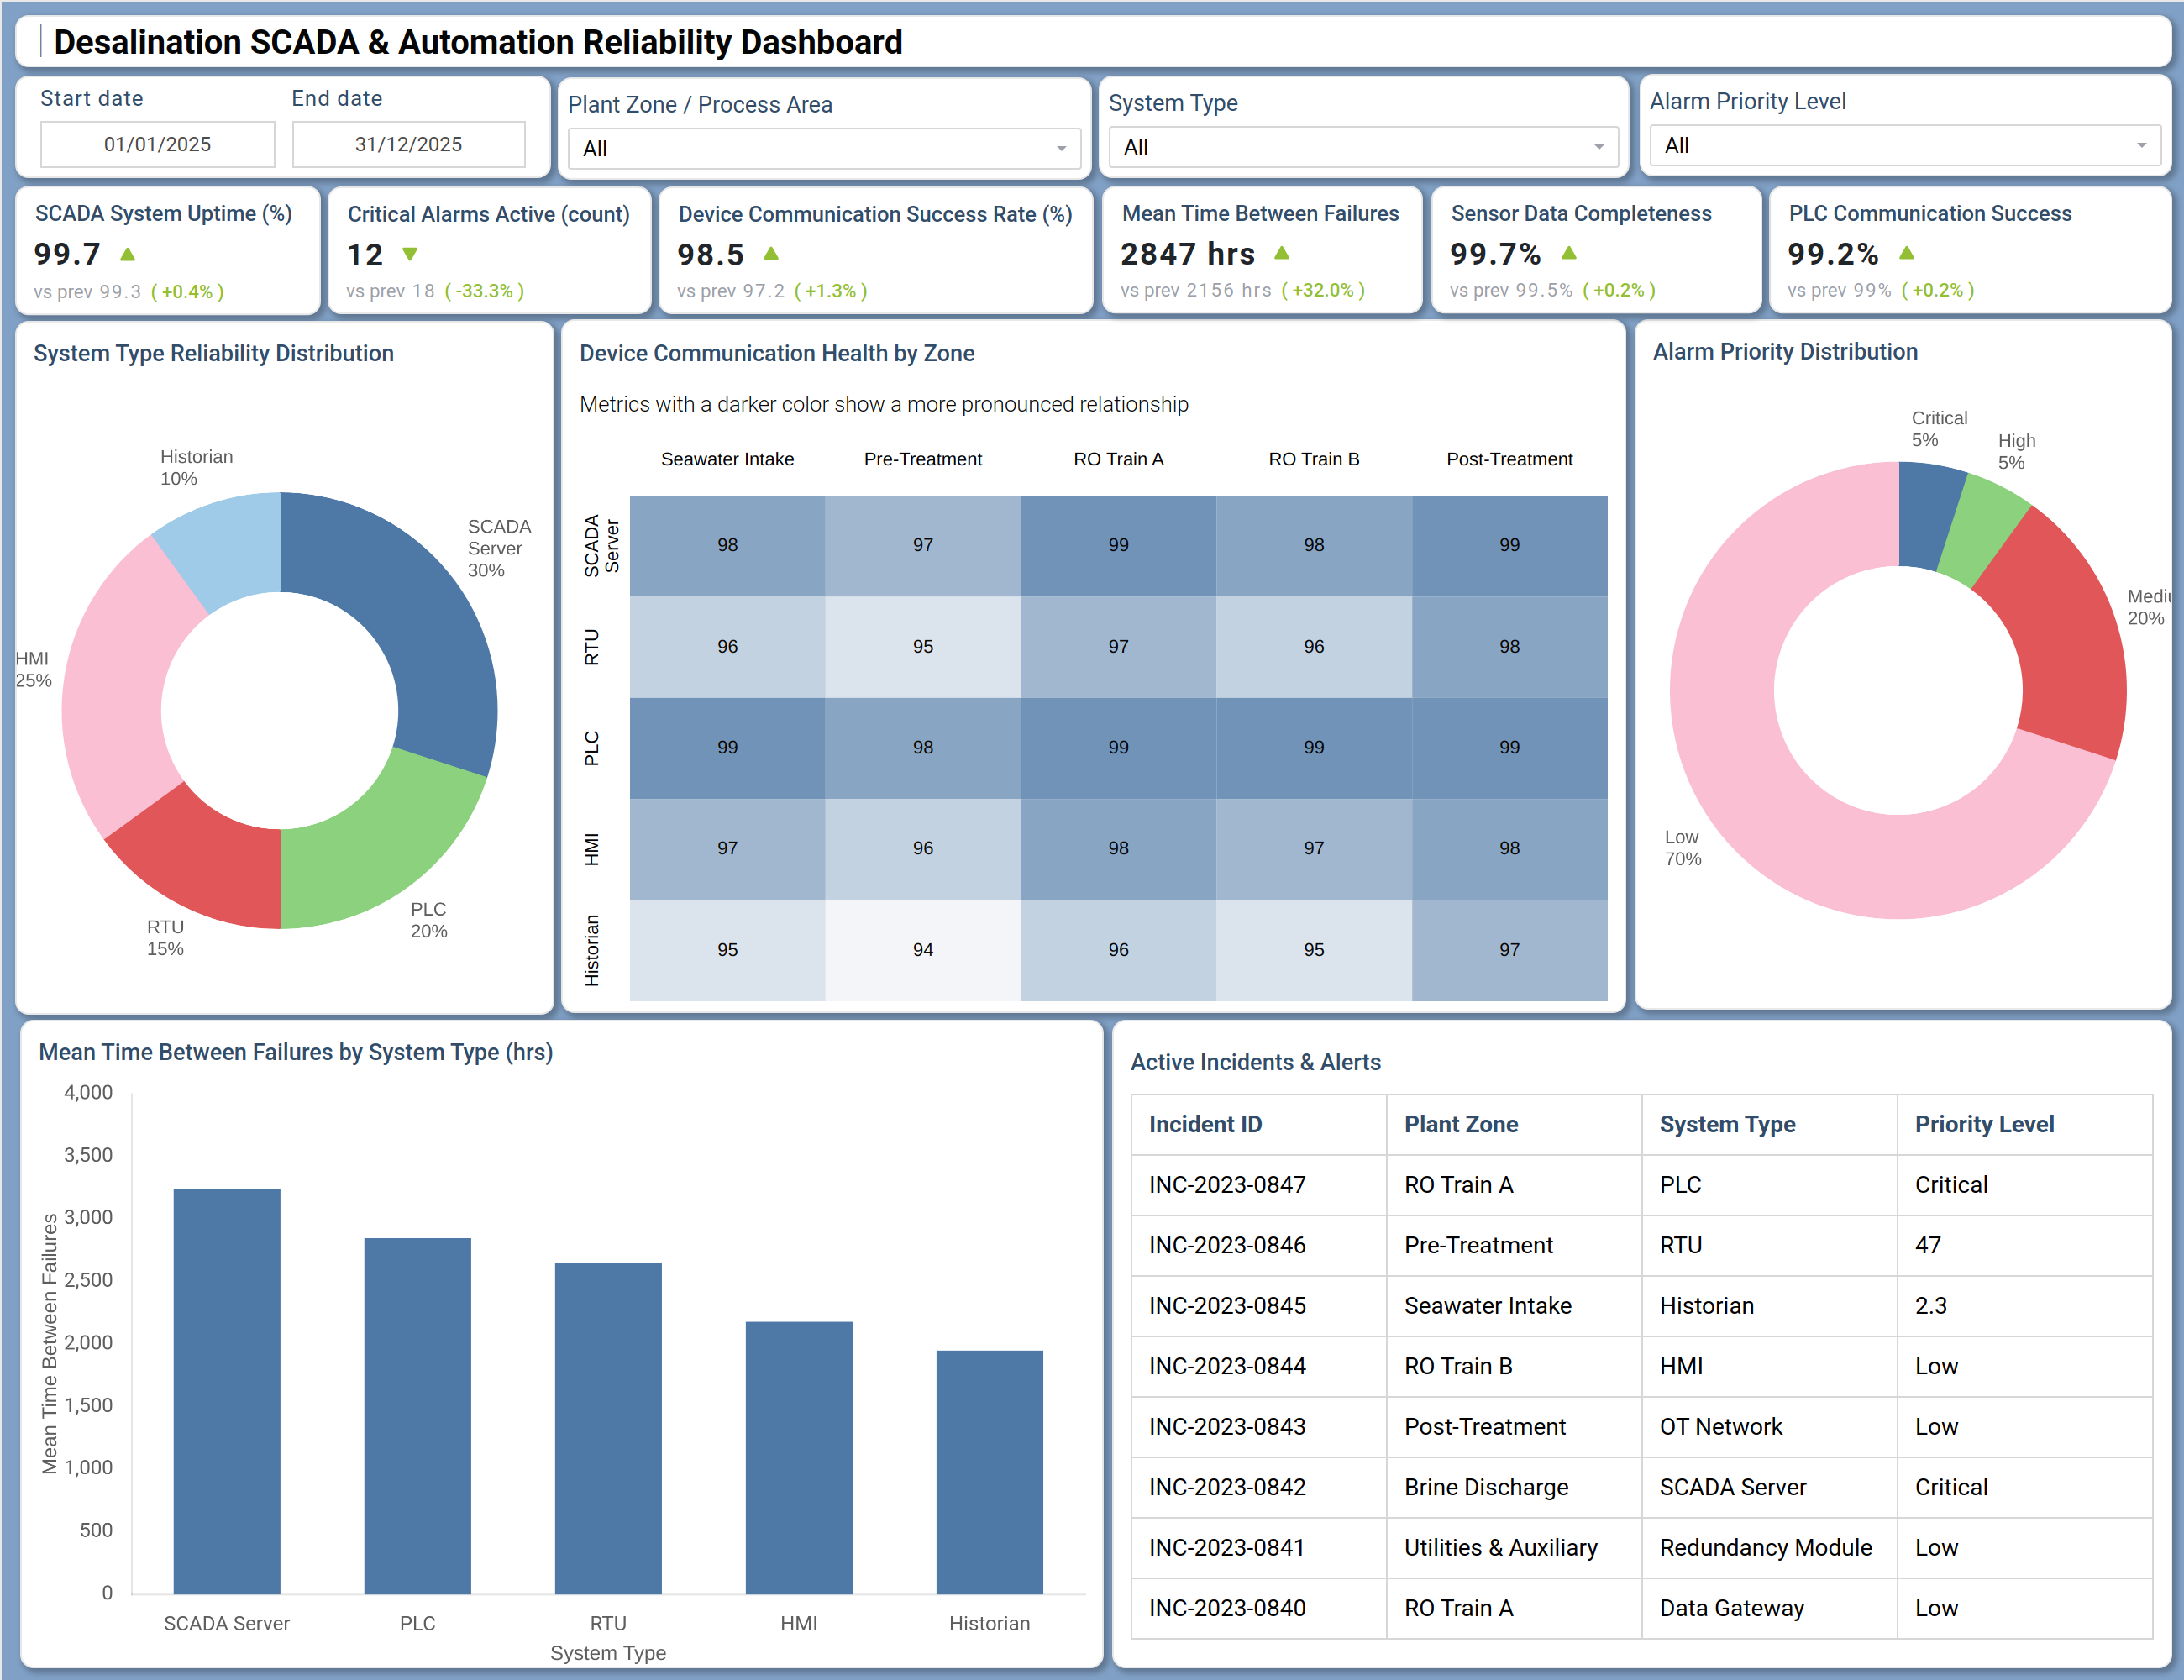
The dashboard opens with five filter dropdowns — Start date, End date, Plant Zone / Process Area, System Type, and Alarm Priority Level — giving operators full control over the scope of analysis. Six KPI tiles display SCADA System Uptime, Critical Alarms Active, Device Communication Success Rate, Mean Time Between Failures, Sensor Data Completeness, and PLC Communication Success, each with a trend indicator showing change versus the prior period.
A System Type Reliability Distribution donut chart and a Mean Time Between Failures by System Type bar chart occupy the left and bottom-left panels, while the center hosts a Device Communication Health by Zone heatmap that visualizes SCADA system uptime monitoring desalination performance across SCADA Server, RTU, PLC, HMI, and Historian rows for five plant zones. The right side features an Alarm Priority Distribution donut chart and an Active Incidents & Alerts table listing open incidents by Incident ID, Plant Zone, System Type, and Priority Level.
How to Analyze Data in a Desalination SCADA & Automation Reliability Dashboard
Here is how you can analyze data from this dashboard:
- Zone-Level Performance Analysis: Use the Plant Zone / Process Area filter to isolate performance across Seawater Intake, Pre-Treatment, RO Trains, Brine Discharge, and Post-Treatment zones.
- Critical Alarm Monitoring: Monitor Critical Alarms Active to detect spikes in open alarms before they escalate into system outages.
- Communication Health Assessment: Review Device Communication Health by Zone to evaluate connectivity across SCADA Server, RTU, PLC, HMI, and Historian systems.
- Failure Frequency Analysis: Use Mean Time Between Failures by System Type to identify systems with the highest failure rates.
- Incident Management Tracking: Analyze Active Incidents & Alerts to track open issues by zone and priority level for effective response planning.
- System-Level Performance Comparison: Filter by System Type to compare communication success rates across PLC, RTU, HMI, and SCADA systems.
- Priority-Based Alert Filtering: Filter by Alarm Priority Level to focus on critical and high-priority alerts and reduce noise.
- Uptime Trend Monitoring: Track SCADA System Uptime over time to measure progress toward availability targets.
Benefits of a Desalination SCADA & Automation Reliability Dashboard
The following are the benefits of using this dashboard:
- Centralized Automation Visibility: Consolidates SCADA uptime, alarms, and communication metrics in one view.
- Comprehensive System Monitoring: Supports simultaneous tracking across SCADA Server, PLC, RTU, HMI, and Historian systems.
- Reduced Manual Reporting: Minimizes effort with pre-built KPI tiles and visualization layouts.
- Zone-Level Reliability Insights: Enables targeted analysis of system performance across plant zones.
- Improved Maintenance Planning: Guides scheduling using failure trends and system performance data.
- Communication Health Transparency: Provides clear visibility into device connectivity across systems.
- Operational Alignment: Helps engineers align SCADA performance with availability targets.
- Shared Performance View: Enables operators and maintenance teams to collaborate using unified data.
KPIs to Track in a Desalination SCADA & Automation Reliability Dashboard
The following key KPIs can be tracked by using this dashboard:
- SCADA System Uptime (%): A core desalination SCADA reliability dashboard metric that tracks the percentage of time SCADA infrastructure remains operational — essential for uninterrupted plant control.
- Critical Alarms Active (count): Tracks the number of currently open critical alarms, giving operations teams a live count to prioritize immediate response actions.
- Device Communication Success Rate (%): Quantifies the percentage of successful communication transactions across all devices, capturing device communication health by zone trends that signal connectivity degradation early.
- Mean Time Between Failures (hrs): Measures the average interval between control system failures, key to mean time between failures SCADA analysis and preventive maintenance planning.
- Sensor Data Completeness (%): Evaluates the percentage of sensor readings successfully captured against expected values, supporting data quality and process integrity across all plant zones.
- PLC Communication Success (%): Tracks the PLC communication success rate across all plant zones, Seawater Intake, Pre-Treatment, RO Train A, RO Train B, and Post-Treatment, to detect PLC-level connectivity issues.
Frequently Asked Questions
Q1. What teams use a Desalination SCADA & Automation Reliability Dashboard?
Plant automation engineers, SCADA system administrators, operations managers, and maintenance technicians working at desalination facilities use this dashboard to track system uptime, manage alarms, and monitor communication health across all control systems.
Q2. How does this dashboard improve operational reliability in desalination plants?
By displaying SCADA System Uptime, Mean Time Between Failures, and Device Communication Success Rate alongside the Active Incidents & Alerts table, the dashboard gives teams a comprehensive view of system health so issues can be identified and resolved before they affect plant output.
Q3. Can this dashboard track communication health across multiple plant zones?
Yes. The Device Communication Health by Zone heatmap displays communication health scores for SCADA Server, RTU, PLC, HMI, and Historian systems across Seawater Intake, Pre-Treatment, RO Train A, RO Train B, and Post-Treatment zones simultaneously.
Q4. How does the Mean Time Between Failures by System Type chart work?
The bar chart plots average failure intervals in hours for each control system type — SCADA Server, PLC, RTU, HMI, and Historian — allowing engineers to identify which system category requires the most maintenance attention and schedule interventions accordingly.
Q5. What does PLC Communication Success measure?
PLC Communication Success tracks the PLC communication success rate as a percentage, measuring how reliably programmable logic controllers exchange data with the SCADA network. A high value indicates stable automation infrastructure; a drop signals a connectivity or hardware issue requiring investigation.