What is a Desalination Membrane & RO System Lifecycle Dashboard?
The Desalination Membrane & RO System Lifecycle Dashboard is a structured analytics template designed for water treatment engineers, plant operations managers, and asset reliability teams responsible for managing reverse osmosis systems. As an RO membrane lifecycle management dashboard, it consolidates critical performance and cost data, including membrane lifespan, integrity, permeate flux, cleaning frequency, and replacement rates, into a single, actionable view.
The template supports desalination plant membrane integrity tracking across multiple RO trains and asset criticality levels, giving operations teams the visibility they need to act before performance degradation affects output quality. Built for facilities running large-scale desalination operations, this dashboard helps engineering and maintenance teams move from reactive membrane management to proactive lifecycle planning.
How to Create a Desalination Membrane & RO System Lifecycle Dashboard
You don’t need to build your report from scratch, just start with a ready-to-use Desalination Membrane & RO System Lifecycle dashboard template from Mokkup. Add in your data and export it however you like. Here’s how to do it:
1. Create or Log in to Your Mokkup Account
Start by signing up on Mokkup.ai using your email. If you already have an account, just log in, and you'll be good to go.
2. Choose and Customize Your Dashboard Template
Find the Desalination Membrane & RO System Lifecycle Dashboard template in the Templates section. Use the drag-and-drop editor to adjust KPIs, edit filters, or add elements based on your data.
3. Export to Your BI Tool
Once your dashboard wireframe is ready, use the BI Tool Export feature to send it directly to Power BI or Tableau for further analysis and enhancements. You can also download the dashboard as a PDF, PNG, or JPEG, embed it on a platform, or invite your team to collaborate.
Note: This is a Pro template. You'll need a Pro subscription on Mokkup to use and customize this dashboard wireframe. Upgrade anytime to unlock full access.
Desalination Membrane & RO System Lifecycle Dashboard Example
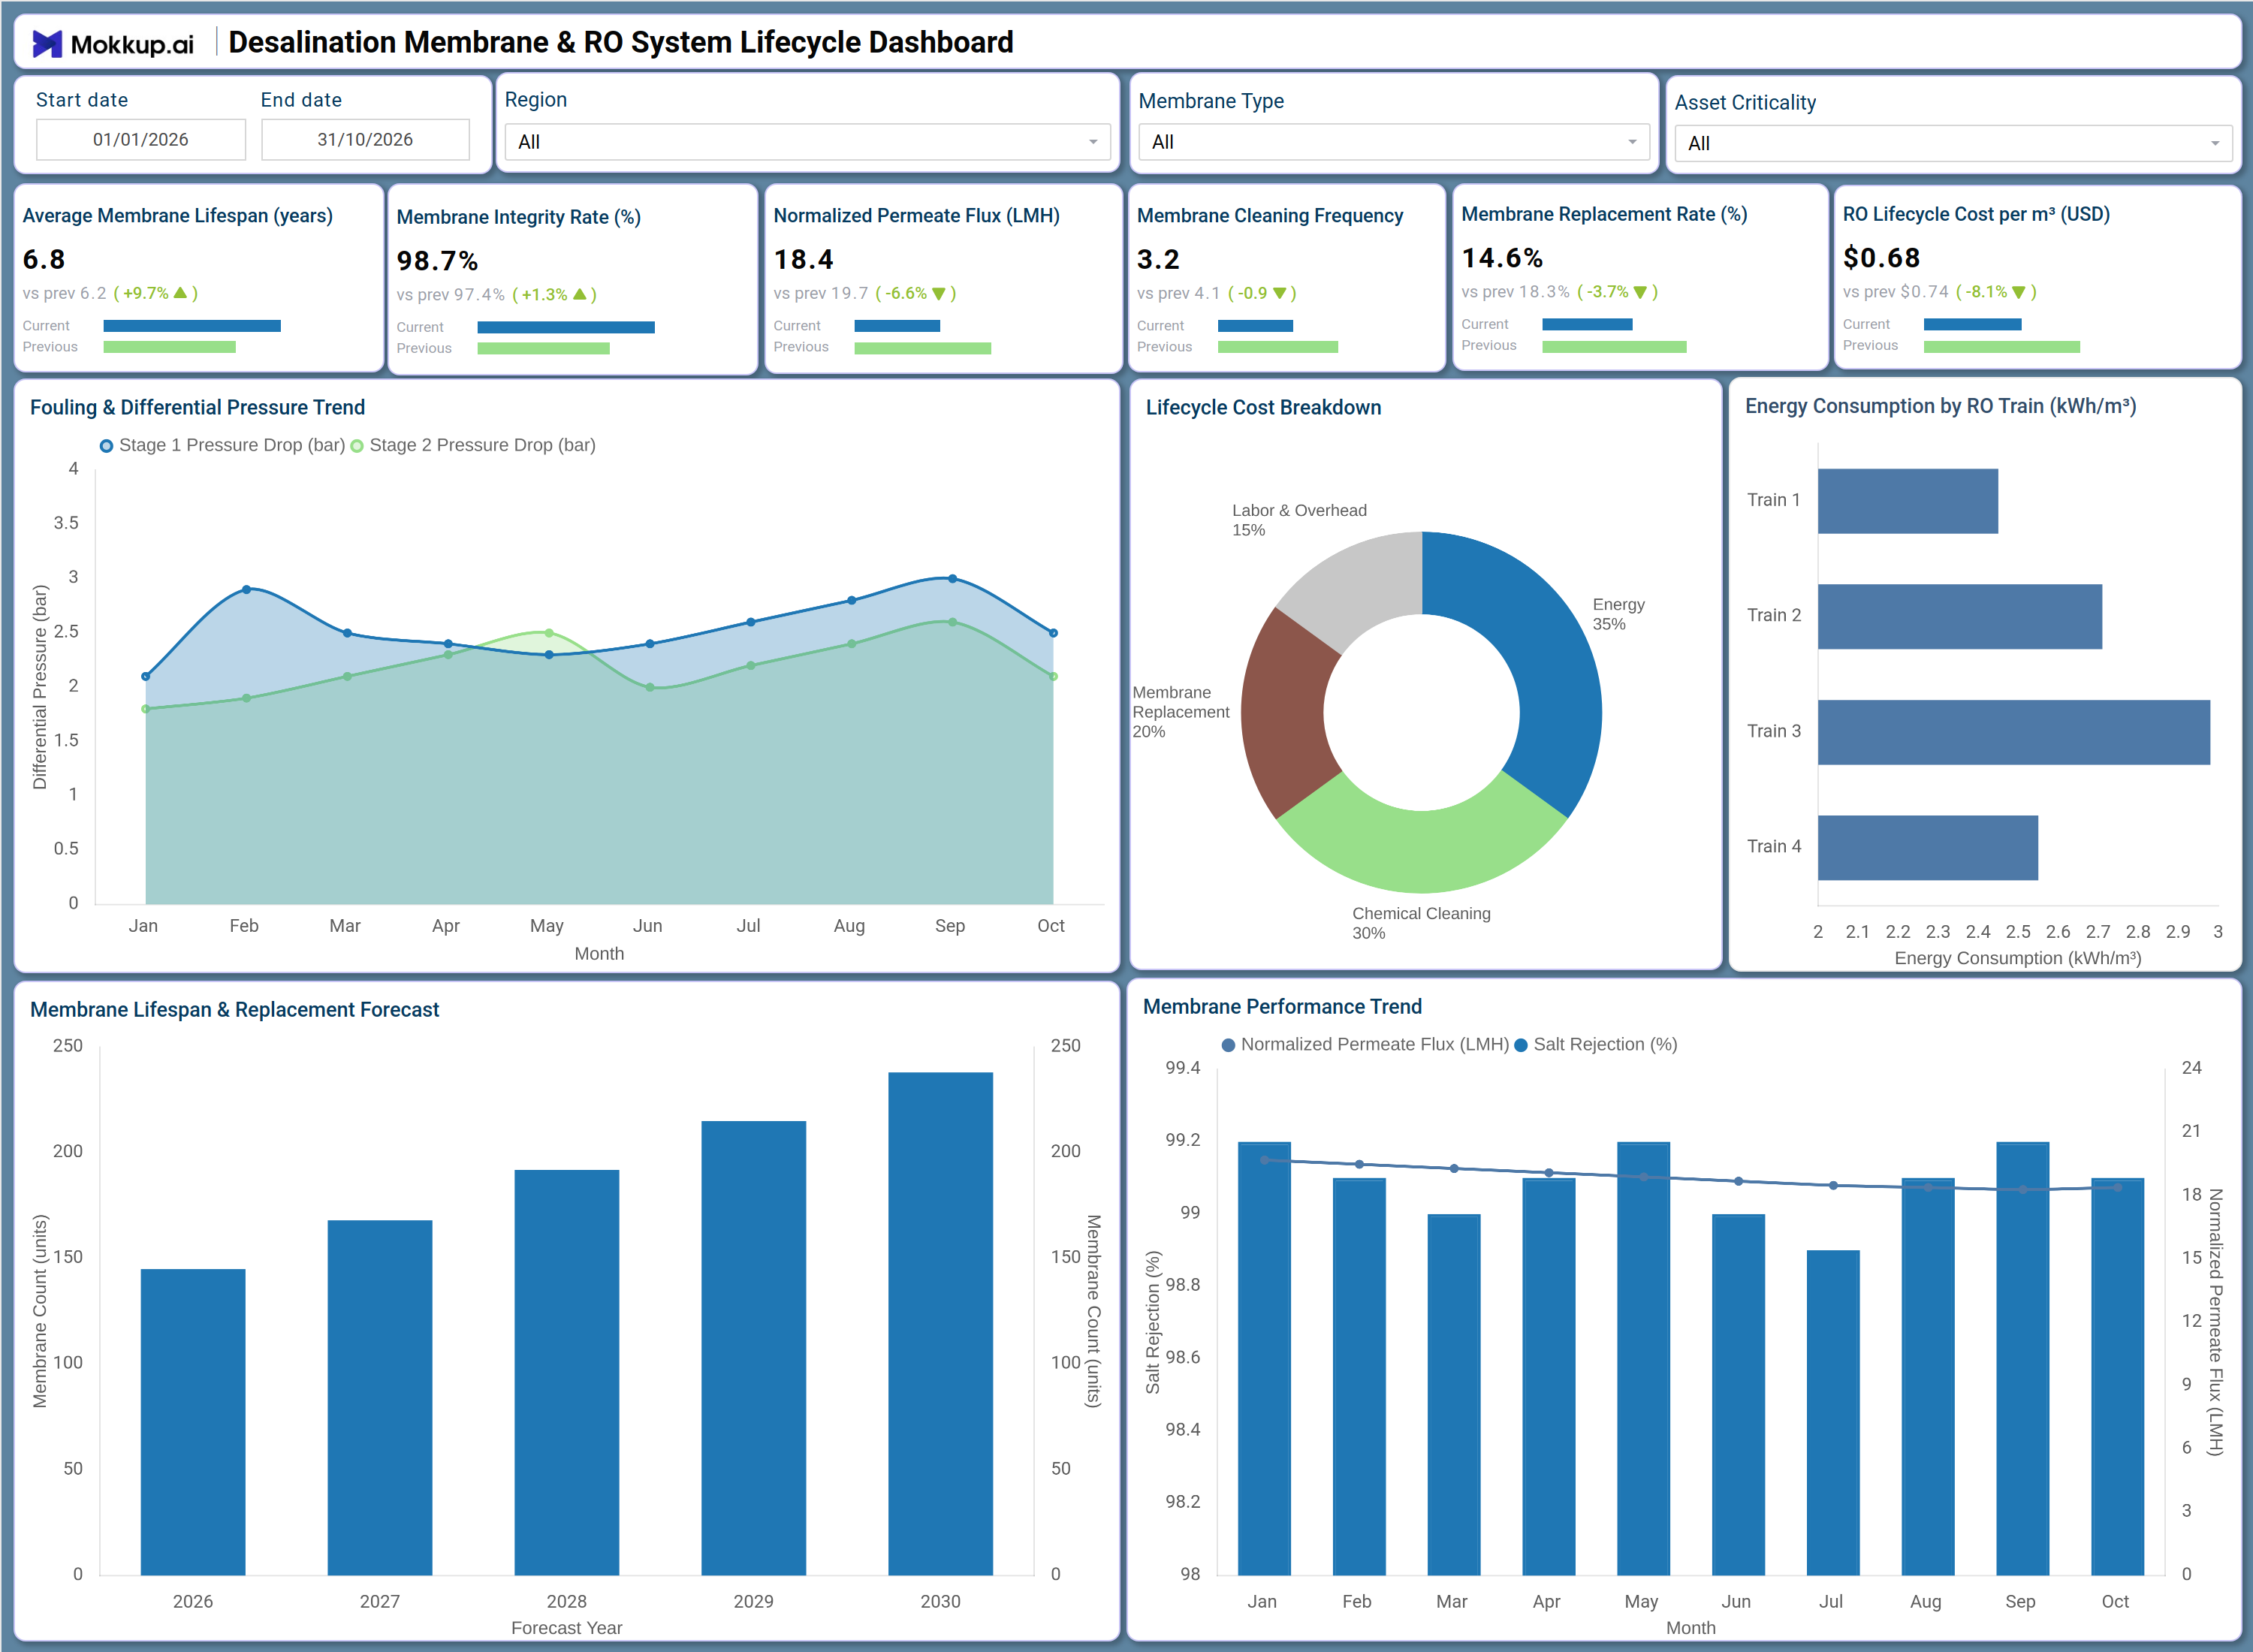
A water treatment operations team at a mid-scale desalination facility uses this dashboard to monitor membrane health across all active RO trains before scheduling maintenance windows. The KPI row gives engineers an immediate read on whether average membrane lifespan, integrity rate, and permeate flux are trending within acceptable operational bands - and where attention is needed first. With desalination membrane performance tracking built into the Fouling & Differential Pressure Trend chart, teams can pinpoint whether pressure buildup is accelerating in specific months and schedule chemical cleaning or replacement accordingly.
The Lifecycle Cost Breakdown and Energy Consumption by RO Train visuals help plant managers assess where operational spend is concentrated, while the Membrane Lifespan & Replacement Forecast gives procurement and asset teams a multi-year view to plan inventory and budget cycles more effectively.
How to Analyze Data in a Desalination Membrane & RO System Lifecycle Dashboard
Here is how you can analyze data from this dashboard:
- Filter by Membrane Type: Compare degradation and performance across membrane models.
- Prioritize Critical Assets: Use asset criticality filters to focus on high-risk RO trains.
- Monitor Fouling Trends: Track differential pressure trends to detect early-stage fouling.
- Review Lifecycle Costs: Analyze cost distribution across energy, cleaning, replacement, and labor.
- Assess Energy Consumption: Identify RO trains with the highest energy use per cubic meter.
- Track Replacement Forecasts: Review membrane lifespan projections to align procurement planning.
- Analyze Performance Trends: Compare permeate flux and salt rejection trends to identify scaling or damage.
- Compare Regional Performance: Evaluate membrane health across geographically distributed facilities.
Benefits of a Desalination Membrane & RO System Lifecycle Dashboard
The following are the benefits of using this dashboard:
- Centralized Lifecycle Visibility: Combines membrane health, cost, and energy metrics in one dashboard.
- Improved Performance Tracking: Supports monitoring across multiple membrane and asset categories.
- Reduced Reporting Effort: Prebuilt KPIs simplify lifecycle and replacement reporting.
- Early Fouling Detection: Highlights pressure trend changes before output quality declines.
- Better Procurement Planning: Provides long-term membrane replacement forecasts.
- Shared Operational Insights: Aligns engineers and asset managers around membrane health and costs.
- Optimized Budget Allocation: Breaks down lifecycle spending across energy, chemicals, labor, and replacements.
KPIs to Track in a Desalination Membrane & RO System Lifecycle Dashboard
The following key KPIs can be tracked by using this dashboard:
- Average Membrane Lifespan (years): Measures the mean service life of membranes across the RO system - a core input for replacement planning and warranty benchmarking.
- Membrane Integrity Rate (%): Tracks the percentage of membranes operating without detected breaches or defects - central to desalination plant membrane integrity tracking and water quality assurance.
- Normalized Permeate Flux (LMH): Quantifies the volume of treated water produced per unit membrane area per hour, adjusted for temperature and pressure - a primary indicator of membrane performance health.
- Membrane Cleaning Frequency: Records how often chemical or physical cleaning cycles are performed - higher frequency may indicate accelerated fouling or sub-optimal pre-treatment.
- Membrane Replacement Rate (%): Supports RO membrane replacement rate optimization by measuring the proportion of membranes replaced within a given period, enabling teams to assess whether replacement is outpacing planned lifecycle targets.
- RO Lifecycle Cost per m3 (USD): Captures the total operational cost per cubic meter of treated water produced - essential for reverse osmosis system lifecycle cost analysis and benchmarking cost efficiency across facilities.
Frequently Asked Questions
Q1. Who benefits most from the Desalination Membrane & RO System Lifecycle Dashboard?
Water treatment plant engineers, asset reliability managers, and operations directors at desalination facilities benefit most. Procurement teams also use it to align membrane inventory plans with replacement forecasts.
Q2. Can this dashboard track membrane fouling trends over time?
Yes. The Fouling & Differential Pressure Trend chart plots Stage 1 and Stage 2 pressure drops month by month, enabling teams to detect fouling patterns and schedule interventions before performance is affected.
Q3. Is this dashboard suitable for multi-train RO plant operations?
Yes. The Energy Consumption by RO Train chart and Asset Criticality filter allow teams to analyze performance at the individual train level, making it well-suited for facilities running multiple parallel RO trains.