
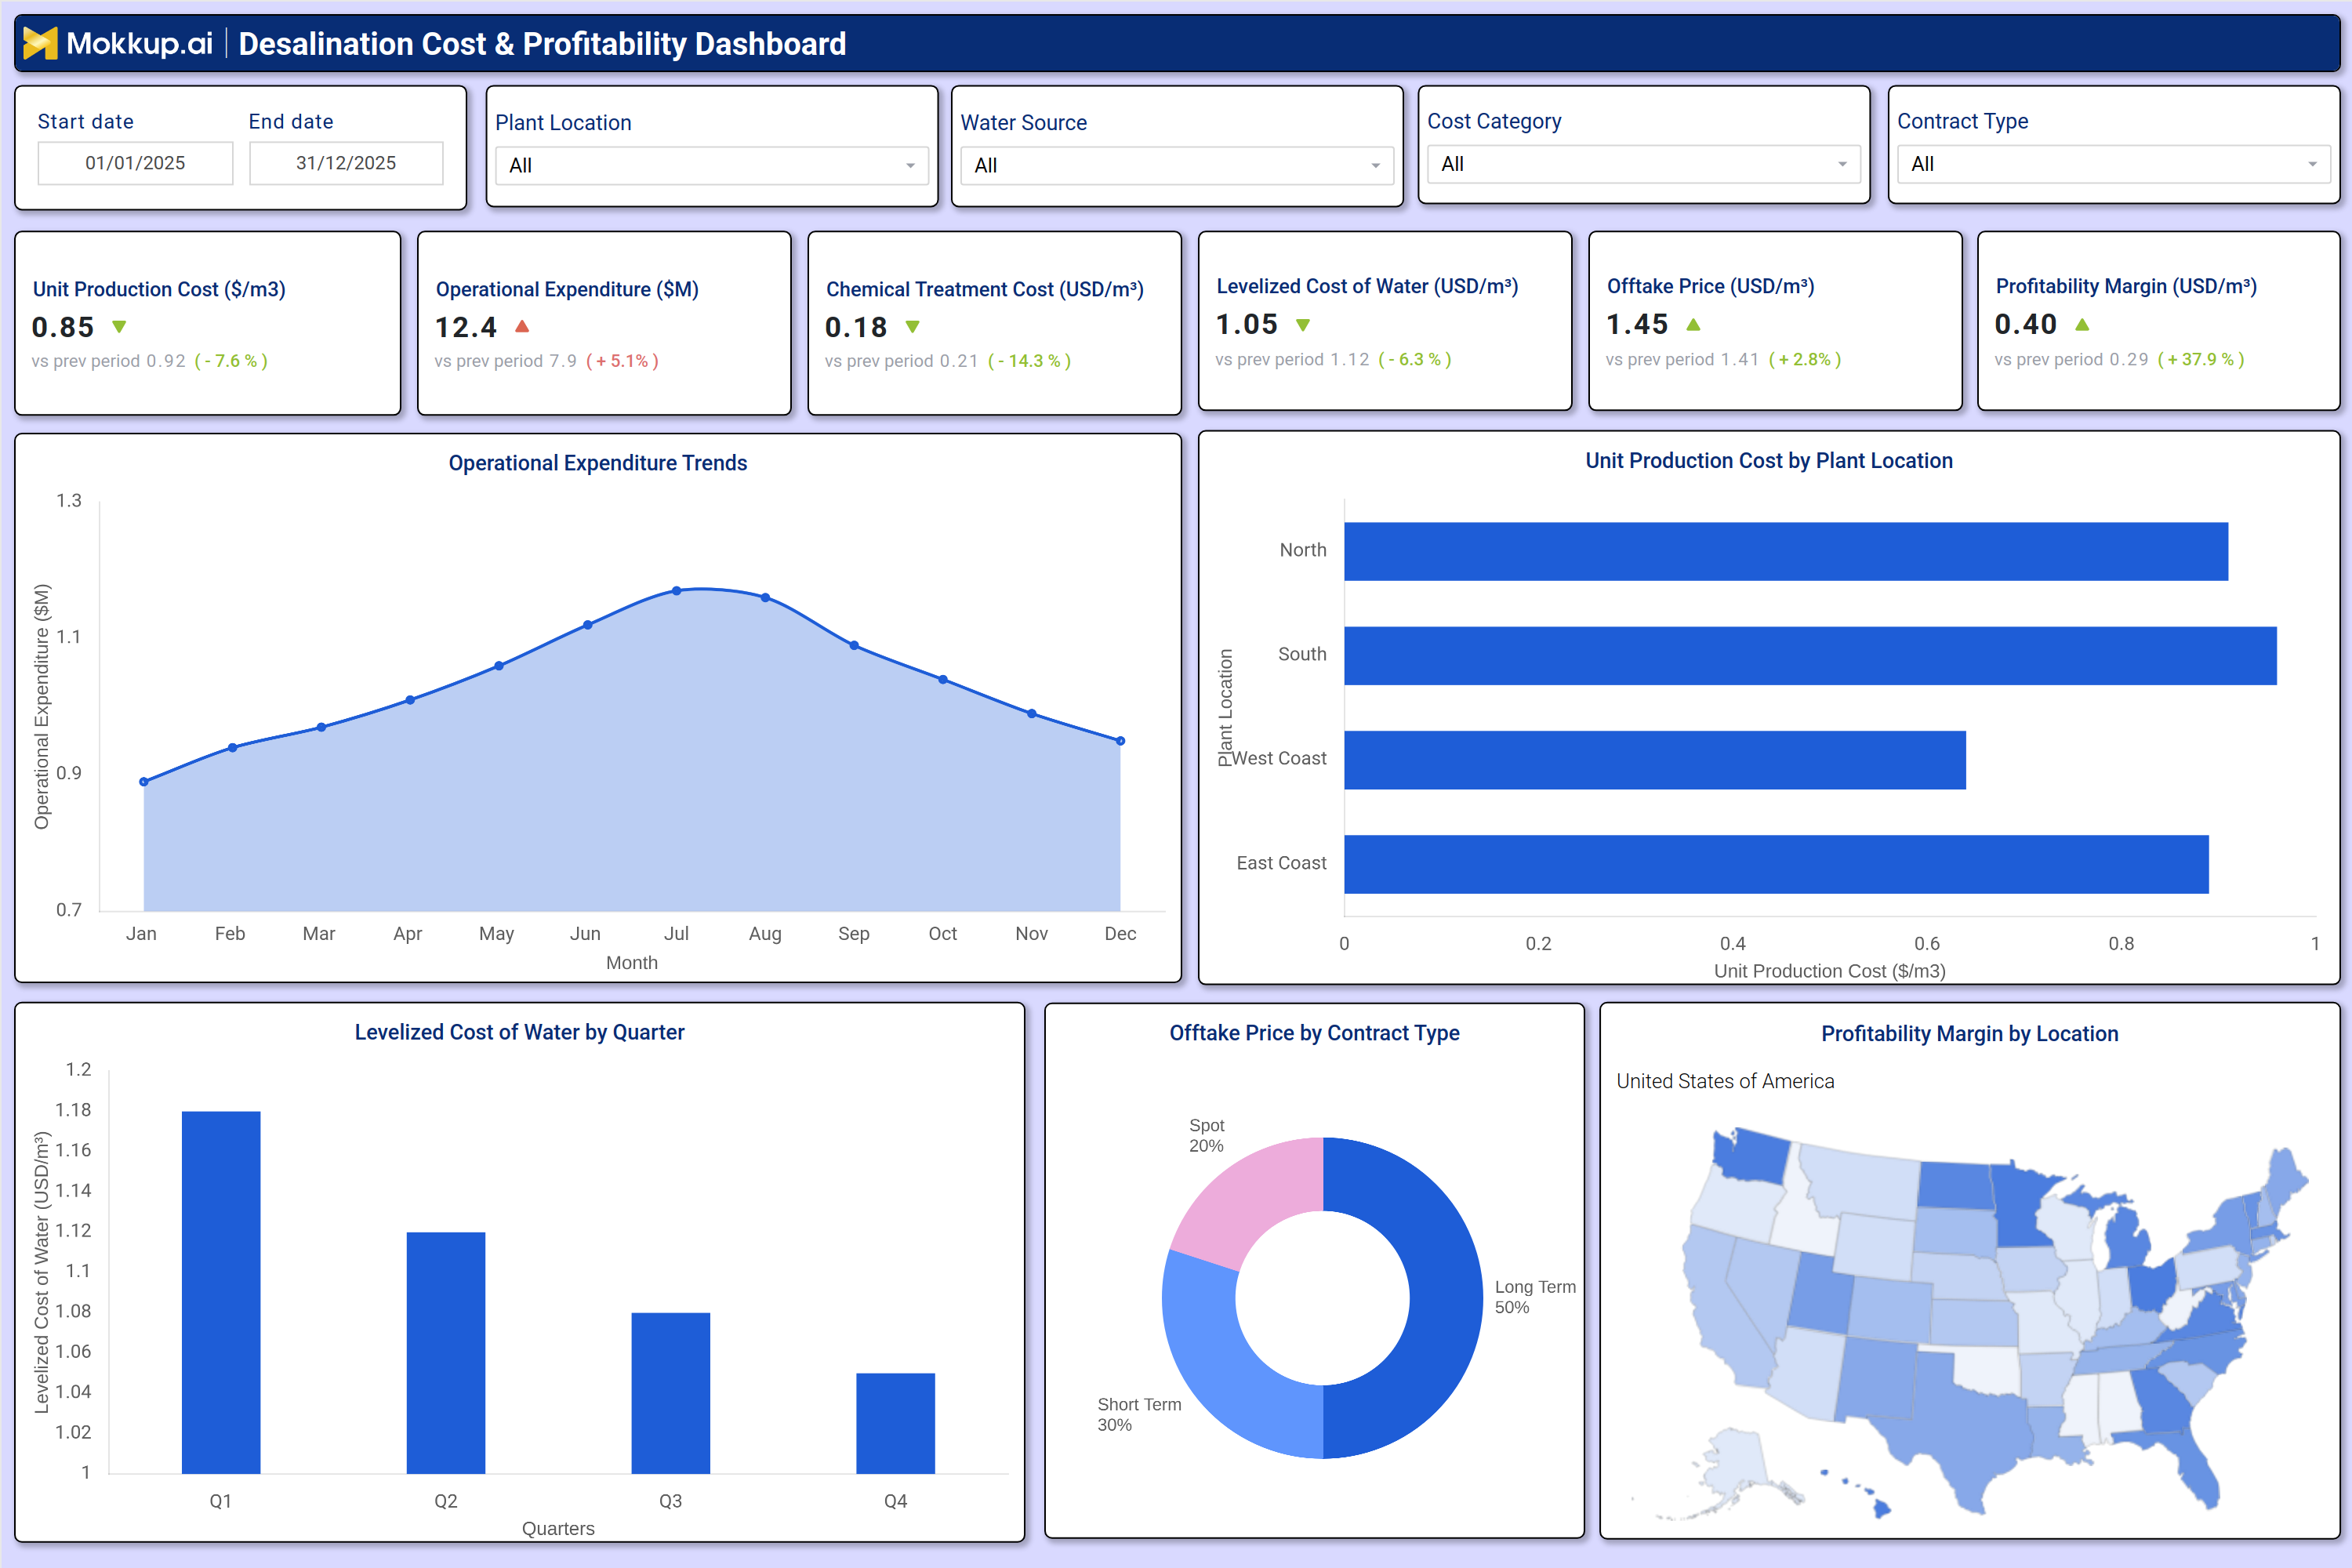
What is a Desalination Cost & Profitability Dashboard?
A Desalination Cost & Profitability Dashboard is a data driven analytics tool designed to monitor financial performance, operational efficiency, and profitability of desalination and wastewater treatment plants. This dashboard consolidates key metrics such as unit production costs, operational expenditure (OPEX), chemical treatment expenses, offtake prices, and profitability margins into a single interface. By tracking these metrics, water utilities can optimize spending, compare desalination vs. wastewater treatment costs, and make informed decisions on infrastructure investments. The dashboard also helps identify cost saving opportunities, assess contract profitability, and ensure sustainable water utility management.
How to Create a Desalination Cost & Profitability Dashboard
You don't need to build your report from scratch, just start with a ready-to-use dashboard template from Mokkup. Add in your data and export it however you like. Here's how to do it:
1. Create or Log in to Your Mokkup Account
Start by signing up on Mokkup.ai using your email. If you already have an account, just log in, and you'll be good to go.
2. Choose and Customize Your Dashboard Template
Find the Desalination Cost & Profitability Dashboard template in the Templates section. Use the drag-and-drop editor to adjust KPIs, edit filters, or add elements based on your data.
3. Export to Your BI Tool
Once your dashboard wireframe is ready, use the BI Tool Export feature to send it directly to Power BI or Tableau for further analysis and enhancements. You can also download the dashboard as a PDF, PNG, or JPEG, embed it on a platform, or invite your team to collaborate.
Note: This is a Pro template. You'll need a Pro subscription on Mokkup to use and customize this dashboard wireframe. Upgrade anytime to unlock full access.
Desalination Cost & Profitability Dashboard Example
A well-structured EPA Regulatory Compliance Dashboard includes interactive filters for date range, plant type, regulatory body, compliance area, and region. Key performance tiles display critical metrics, such as environmental penalty costs, regulatory audit costs, inspections passed, compliance scores, critical violations, and permit exceedance events. Trend charts track monthly penalty costs, permit exceedances, and audit expenses, allowing utilities to compare current performance against historical data. A compliance score heatmap by plant location helps identify underperforming facilities, while a regulatory inspections breakdown shows which agencies (EPA, WHO, local authorities) conduct the most audits. Additionally, a critical violations bar chart highlights high-risk plant types, enabling targeted corrective actions. Together, these components form a comprehensive environmental compliance tracking system that helps utilities maintain regulatory adherence, reduce fines, and improve operational sustainability.
How to Analyze Data in a Desalination Cost & Profitability Dashboard
- Compare unit production costs across plant locations: Identifies inefficiencies by benchmarking costs across facilities.
- Track operational expenditure trends: Detects cost spikes to optimize budgeting and spending control.
- Monitor chemical treatment costs: Evaluates cost-saving opportunities in desalination processes.
- Assess levelized cost of water (LCOW): Determines long-term financial viability of water production.
- Analyze offtake price variations by contract type: Optimizes revenue by understanding pricing differences.
- Evaluate profitability margins by region: Identifies high- and low-performing plants for strategic action.
- Review cost category breakdowns: Pinpoints major expense drivers like energy, labor, and maintenance.
- Benchmark performance against historical data: Measures improvements or declines over time.
Benefits of a Desalination Cost & Profitability Dashboard
- Enhances financial transparency in water treatment operations: Tracks desalination and wastewater costs for clear financial visibility.
- Improves cost efficiency by identifying high expense areas: Highlights cost-intensive operations to optimize spending.
- Supports data-driven decision-making for investments and contracts: Enables informed choices on infrastructure and supplier agreements.
- Optimizes profitability by comparing prices and production costs: Aligns revenue with cost structures to improve margins.
- Reduces operational risks by monitoring key expenses: Tracks chemical and energy costs to prevent overspending.
- Enables benchmarking against industry standards: Compares performance with peers to identify improvement areas.
- Streamlines reporting for compliance and stakeholders: Simplifies reporting for regulatory needs and business communication.
KPIs to Track in a Desalination Cost & Profitability Dashboard
- Unit Production Cost ($/m³): Measures the cost of producing one cubic meter of desalinated or treated water.
- Operational Expenditure ($M): Tracks total spending on plant operations, including labor, energy, and maintenance.
- Chemical Treatment Cost (USD/m³): Evaluates expenses related to chemicals used in desalination and wastewater treatment.
- Levelized Cost of Water (USD/m³): Calculates the average cost of water production over the plant's lifespan.
- Offtake Price (USD/m³): Monitors the selling price of treated water under different contract types.
- Profitability Margin (USD/m³): Assesses the net profit per cubic meter of water produced.
Frequently Asked Questions
1. What is a Water Treatment ROI Dashboard used for?
A Water Treatment ROI Dashboard is a financial tracking tool that helps water utilities monitor production costs, operational expenses, and the profitability of desalination plants. It provides insights into cost-saving opportunities and investment decisions.
2. What data sources feed into a desalination and wastewater OPEX/CAPEX tracking tool?
Data sources include SCADA systems, financial ERP software, energy consumption logs, chemical usage reports, and contract management platforms.
3. Who should use a water utility financial dashboard for desalination projects?
Plant managers, financial analysts, utility executives, and policymakers use this dashboard to track costs, assess ROI, and make data-driven decisions for desalination and wastewater treatment projects.