What is a Dermatology Clinical Care Dashboard?
A Dermatology Clinical Care Dashboard is a healthcare performance monitoring tool that provides real-time insights into clinical outcomes, treatment success, and patient consultation efficiency. It consolidates clinical data from multiple sources, such as patient visits, treatment outcomes, follow-up adherence, and satisfaction scores, into a unified analytics platform.
This dermatology clinical dashboard template enables hospitals and clinics to track trends in skin conditions, assess treatment performance, and optimize patient flow efficiency. It supports clinicians in making data-driven decisions to improve both care quality and operational workflow within dermatology departments.
How To Create a Dermatology Clinical Care Dashboard
You don’t need to build your report from scratch—just start with a ready-to-use sample Dermatology Clinical Care dashboard template from Mokkup. Add in your data and export it however you like. Here’s how to do it:
1. Create or Log in to Your Mokkup Account
Start by signing up on Mokkup.ai using your email. If you already have an account, just log in, and you’ll be good to go.
2. Choose and Customize Your Dashboard Template
You can find the Dermatology Clinical Care Dashboard template in the Templates section. Use the drag-and-drop editor to adjust KPIs, edit filters, or add elements based on your data.
3. Export to Your BI Tool
Once your dashboard wireframe is ready, use the BI Tool Export feature to send it directly to Power BI or Tableau for further analysis and enhancements. You can also download the dashboard as a PDF, PNG, or JPEG, embed it on a platform, or invite your team to collaborate.
Note: This is a Pro template. You’ll need a Pro subscription on Mokkup to use and customize this dashboard wireframe. Upgrade anytime to unlock full access.
Dermatology Clinical Care Dashboard Example
The Clinical Outcomes & Condition Insights screen focuses on condition trends, treatment effectiveness, and patient satisfaction. KPIs like Treatment Success Rate, Follow-Up Adherence, and Satisfaction Scores help measure the quality of care. The Top 5 Skin Conditions chart highlights common dermatologic issues such as acne, psoriasis, eczema, and fungal infections, allowing administrators to identify high-demand areas. The Treatment Success vs. Revisit Rate graph compares therapy outcomes against patient revisit frequency, offering actionable insights for treatment improvement.
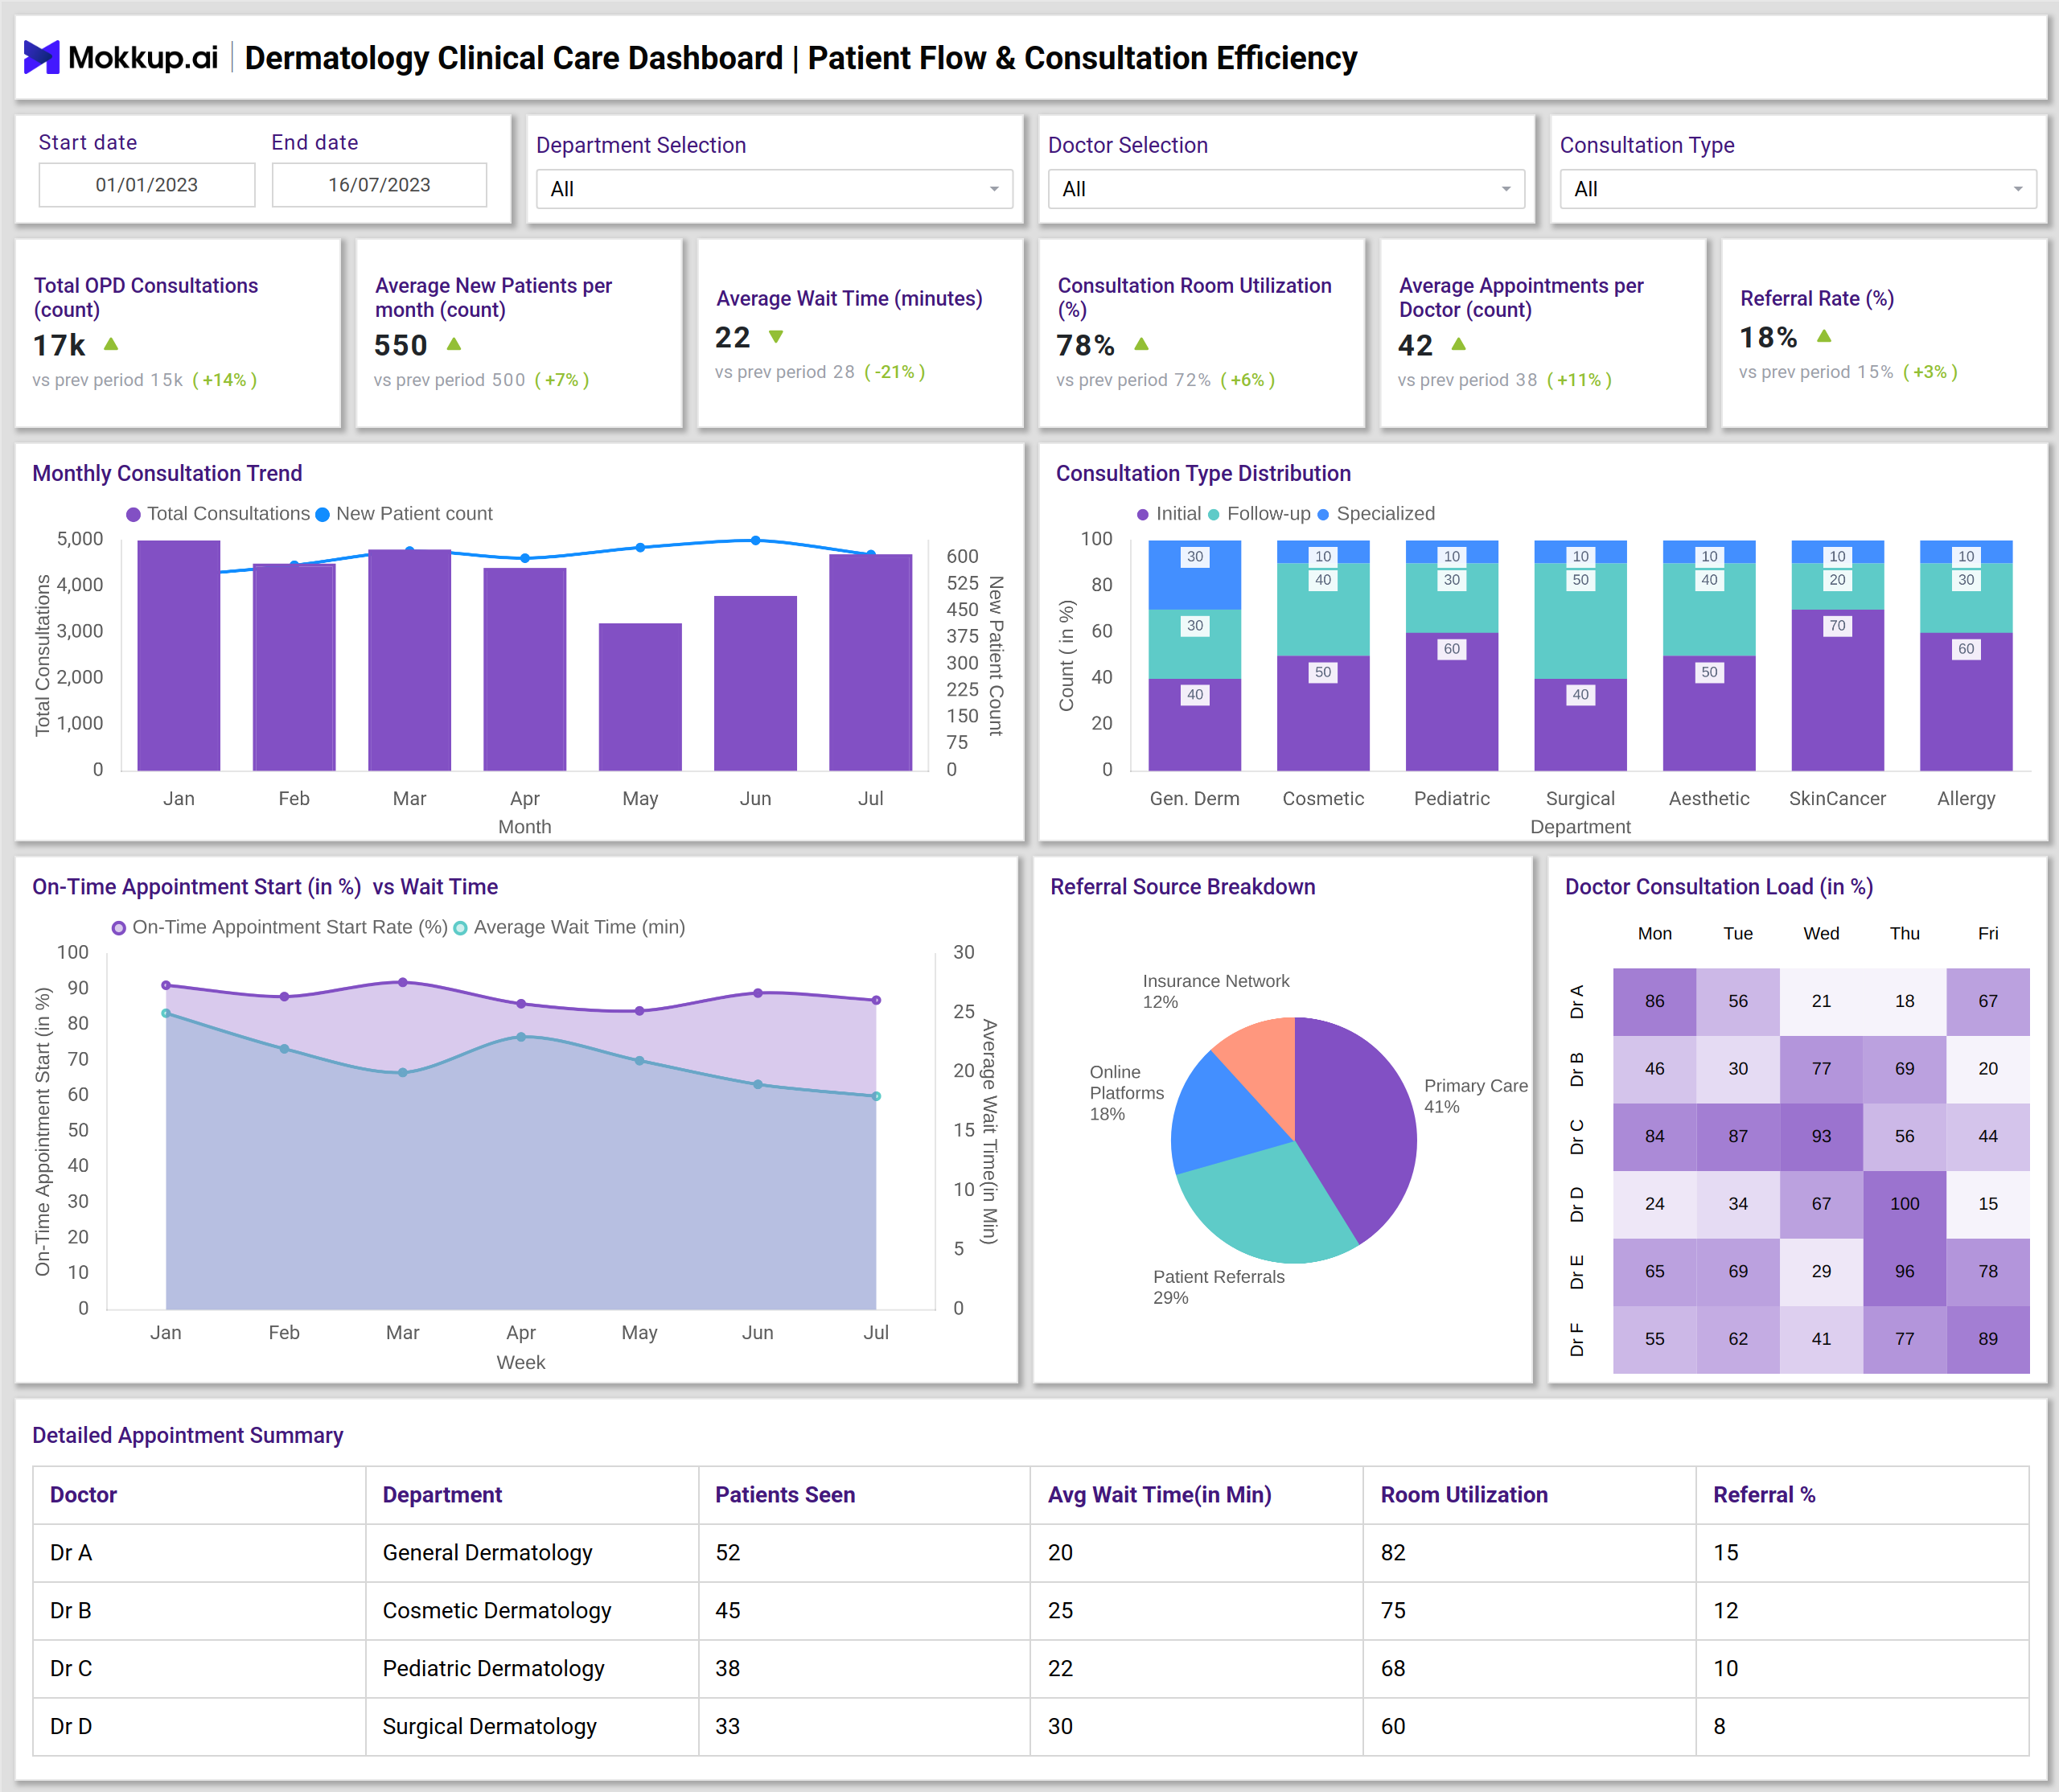
The Patient Flow & Consultation Efficiency screen focuses on operational performance and workflow optimization. It tracks Consultation Room Utilization, Average Wait Time, Appointments per Doctor, and Referral Rate to measure service efficiency. Visuals such as Monthly Consultation Trends and Consultation Type Distribution reveal appointment volume and visit patterns across new, follow-up, and specialist consultations.
Together, these insights make the dermatology clinical efficiency dashboard template a powerful tool for healthcare providers to track patient progress, reduce operational inefficiencies, and improve consultation experiences.
How to Analyze Data in Dermatology Clinical Dashboards
To get the most out of your Dermatology Clinical Care Dashboard, you can:
- Track Treatment Outcomes – Evaluate treatment success and follow-up adherence rates to measure care quality.
- Monitor Patient Satisfaction – Utilize patient feedback data to enhance the service experience.
- Analyze Consultation Efficiency – Measure wait times, utilization rates, and the number of appointments per doctor.
- Identify Condition Trends – Track the prevalence of primary skin conditions across demographics.
- Evaluate Referral Channels – Identify which channels yield the most patients to inform better outreach strategies.
Benefits of Dermatology Clinical Care Dashboards
Implementing a skin care analytics dashboard provides multiple benefits:
- Improved Care Quality – Monitors treatment effectiveness across common conditions.
- Operational Optimization – Enhances appointment scheduling and staff utilization.
- Patient-Centered Insights – Tracks satisfaction and recovery metrics in real time.
- Performance Transparency – Measures doctor performance and patient outcomes simultaneously.
- Strategic Growth Support – Data helps identify high-demand treatments and optimize resource allocation.
KPIs to Track in Dermatology Clinical Care Dashboards
The key KPIs in the dermatology performance monitoring dashboard are:
- Treatment Success Rate (%) – Measures the percentage of successful treatments across conditions.
- Follow-Up Adherence (%) – Tracks how consistently patients attend follow-up appointments.
- Patient Satisfaction (%) – Reflects patient feedback on service quality and care delivery.
- Average Wait Time (Minutes) – Indicates operational efficiency in handling patient consultations.
- Consultation Room Utilization (%) – Evaluates how effectively clinical rooms are used.
Frequently Asked Questions
1. Why is a Dermatology Clinical Care Dashboard important?
It enables hospitals and clinics to monitor treatment performance, operational efficiency, and patient satisfaction in real-time.
2. Who can benefit from using this dashboard?
Dermatology clinics, cosmetic centers, and hospital dermatology departments can all leverage this dashboard to improve service efficiency and outcomes.