
What is a Dermatology Center Inventory & Pharmacy Dashboard?
A Dermatology Center Inventory & Pharmacy Dashboard is a real-time analytics solution designed to help dermatology and cosmetology centers efficiently manage their medical inventory, pharmacy operations, and supplier performance. This dermatology center inventory management dashboard consolidates key data such as stock levels, expiry tracking, reorder alerts, and sales trends across multiple branches, giving administrators complete control over resource utilization. It functions as a real-time pharmacy stock tracking tool, ensuring timely replenishment of essential medicines, minimizing wastage, and optimizing working capital. By integrating with procurement and billing systems, the dashboard enhances visibility across the entire supply chain—helping healthcare institutions maintain compliance, improve profitability, and streamline patient service delivery.
How to Create a Dermatology Center Inventory & Pharmacy Dashboard
You don’t need to build your report from scratch—just start with a ready-to-use dashboard template from Mokkup. Add in your data and export it however you like. Here’s how to do it:
1. Create or Log in to Your Mokkup Account
Start by signing up on Mokkup.ai using your email. If you already have an account, just log in, and you’ll be good to go.
2. Choose and Customize Your Dashboard Template
Find the Dermatology Center Inventory & Pharmacy Dashboard template in the Templates section. Use the drag-and-drop editor to adjust KPIs, edit filters, or add elements based on your data.
3. Export to Your BI Tool
Once your dashboard wireframe is ready, use the BI Tool Export feature to send it directly to Power BI or Tableau for further analysis and enhancements. You can also download the dashboard as a PDF, PNG, or JPEG, embed it on a platform, or invite your team to collaborate.
Note: This is a Pro template. You’ll need a Pro subscription on Mokkup to use and customize this dashboard wireframe. Upgrade anytime to unlock full access.
Dermatology Center Inventory & Pharmacy Dashboard Example
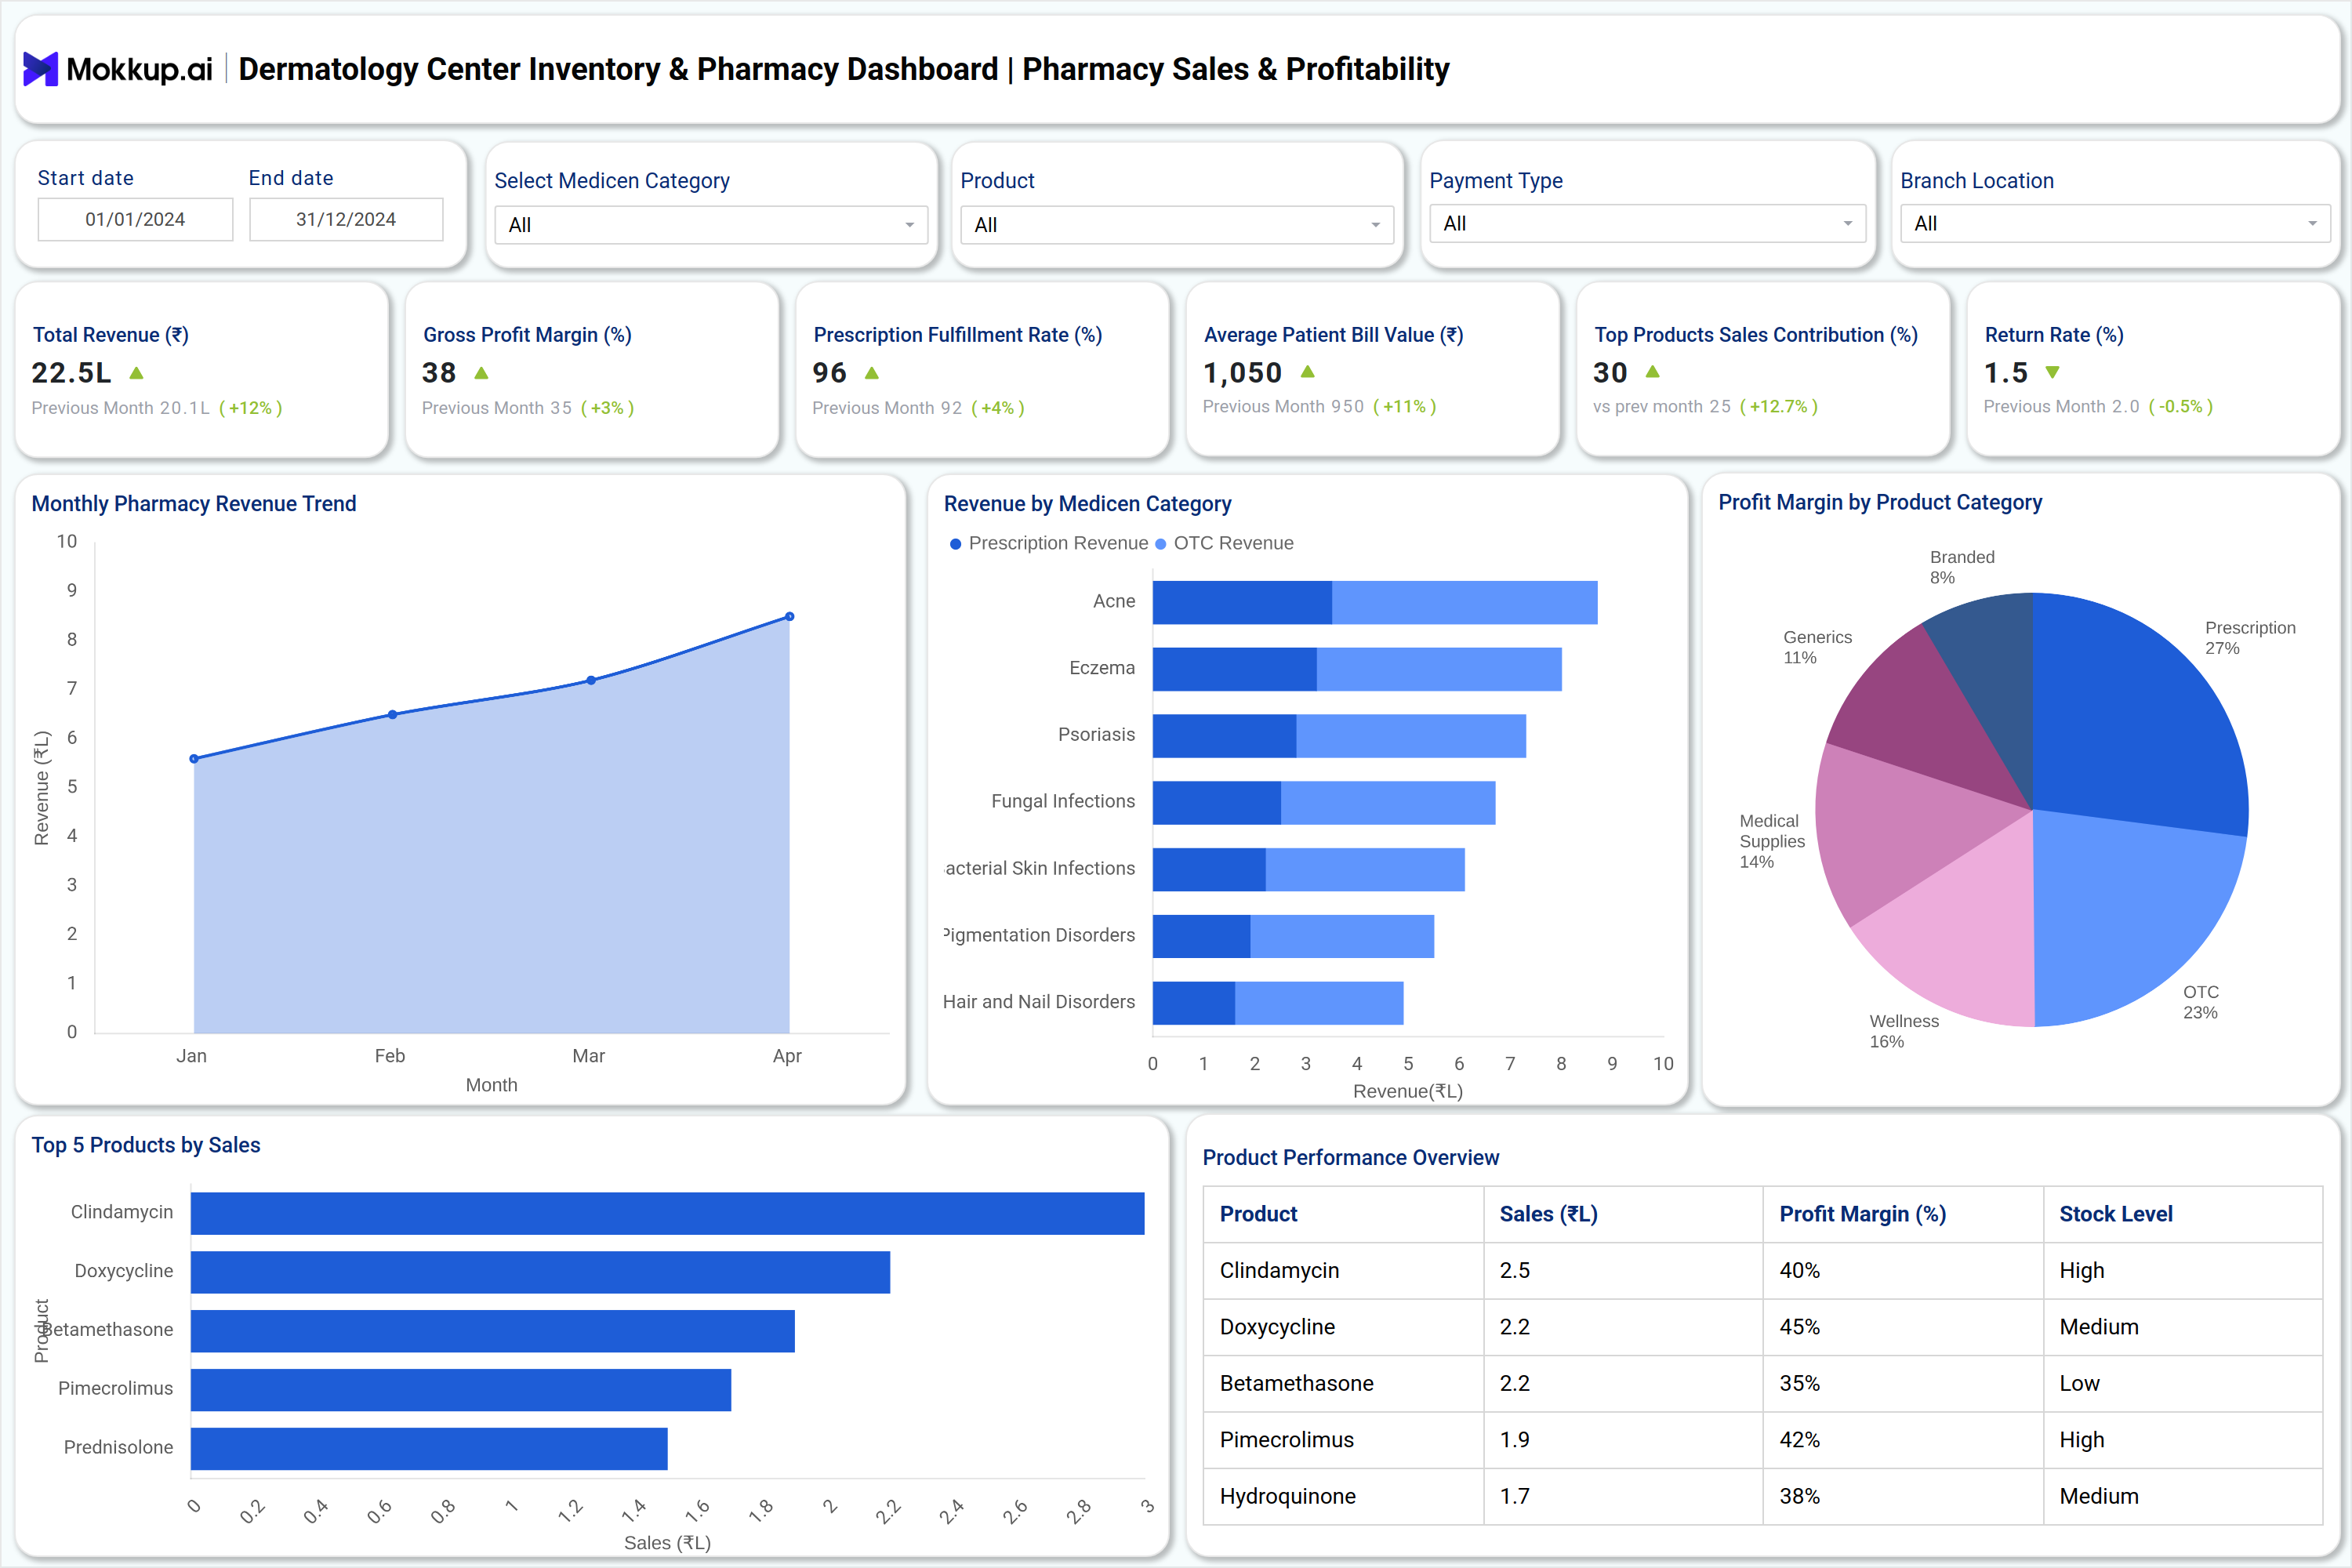
You can create your own skin clinic pharmacy performance dashboard by combining analytics for inventory, procurement, and pharmacy sales into one unified platform. This example dashboard includes three key modules—Inventory Status & Stock Management, which tracks active SKUs, inventory value, and expiry losses; Procurement & Supplier Performance, which monitors supplier reliability, delivery timeliness, and defect rates; and Pharmacy Sales & Profitability, which analyzes sales trends, margins, and prescription fulfillment. Together, these modules create a pharmacy sales and usage dashboard that enables dermatology centers to monitor operations from stock movement to sales revenue. This comprehensive setup supports dermatology medicine dispensing analytics and ensures decision-making based on accurate, real-time insights.
How to Analyze Data in a Dermatology Center Inventory & Pharmacy Dashboard
To analyze data effectively in this dashboard:
- Track Stock Levels: Monitor category-wise stock (including medicines, injectables, skincare, cosmetics, and consumables) to identify shortages or overstocked items.
- Measure Inventory Turnover: Utilize turnover trends to evaluate the speed at which inventory is sold and whether reorder cycles are aligned with demand.
- Monitor Supplier Efficiency: Analyze delivery timelines, defect rates, and purchase values by supplier to improve procurement reliability.
- Evaluate Sales Performance: Review pharmacy revenue trends, profit margins, and product category contribution for staff performance optimization.
- Watch Expiry & Reorder Data: Use expiry tracking and reorder alerts to minimize wastage and ensure uninterrupted supply.
- Compare Branch Insights: Filter by location or supplier to evaluate performance across different clinics or branches.
Benefits of a Dermatology Center Inventory & Pharmacy Dashboard
- Centralized Inventory Control: Consolidates data from multiple stores and suppliers in one unified dashboard.
- Reduced Stockouts and Expiry Losses: Tracks reorder points and expiry dates to ensure product availability and minimize financial loss.
- Data-Driven Purchasing: Supports smarter procurement decisions by analyzing vendor reliability and purchase costs.
- Improved Profitability: The dermatology medicine dispensing analytics feature links prescription patterns with revenue performance.
- Enhanced Pharmacy Operations: Real-time insights into dispensing trends and sales metrics for better operational planning.
- Optimized Resource Allocation: Identifies high-demand products, enabling efficient stock distribution across branches.
- Regulatory Compliance: Provides transparency in medication handling, ensuring compliance with healthcare and safety standards.
KPIs to Track in a Dermatology Center Inventory & Pharmacy Dashboard
Key performance indicators that provide actionable insights include:
- Total Active SKUs: Number of products currently available across branches.
- Inventory Value (₹): Total value of all medicines and consumables in stock.
- Inventory Turnover (Days): Average number of days taken to clear existing stock.
- Stockout Incidents: Count of times a product was unavailable when needed.
- Expiry Losses (₹): Financial value of products wasted due to expiration.
- Reorder Lead Time (Days): Average time between placing and receiving orders.
- Supplier On-Time Delivery (%): Measures supplier reliability in terms of timely deliveries.
- Gross Profit Margin (%): This metric indicates the financial efficiency of a pharmacy's operations.
These KPIs enable dermatology centers to balance cost, availability, and patient satisfaction through data-driven decision-making.
Frequently Asked Questions
1. What is the purpose of a Dermatology Center Inventory & Pharmacy Dashboard?
It helps clinics monitor inventory levels, sales performance, and supplier efficiency, improving cost control and operational reliability.
2. How often is the data updated?
Data is updated in real time, ensuring pharmacy and stock decisions are based on the latest performance insights.
3. Who benefits from this dashboard?
Clinic managers, pharmacy supervisors, procurement officers, and finance teams can all use it to enhance efficiency and transparency.