What is a Dermatology Center Diagnostics & Laboratory Dashboard?
A Dermatology Center Diagnostics & Laboratory Dashboard is a comprehensive digital platform that consolidates operational, quality, and financial data from dermatology laboratories into a single, interactive interface. It enables real-time monitoring of lab efficiency, diagnostic accuracy, and profitability through advanced Dermatology laboratory data analytics. By integrating inputs from laboratory information systems, billing tools, and quality control modules, the dashboard provides healthcare administrators with precise insights into performance indicators such as turnaround time, equipment uptime, technician productivity, and cost control. Functioning as both a Dermatology diagnostic lab dashboard and a Dermatology center lab reporting tool, it supports compliance tracking, enhances decision-making, and ensures that laboratory operations align with patient care standards and institutional goals.
How to Create a Dermatology Center Diagnostics & Laboratory Dashboard
You don’t need to build your report from scratch—just start with a ready-to-use dashboard template from Mokkup. Add in your data and export it however you like. Here’s how to do it:
1. Create or Log in to Your Mokkup Account
Start by signing up on Mokkup.ai using your email. If you already have an account, just log in, and you’ll be good to go.
2. Choose and Customize Your Dashboard Template
Find the Dermatology Center Diagnostics & Laboratory Dashboard template in the Templates section. Use the drag-and-drop editor to adjust KPIs, edit filters, or add elements based on your data.
3. Export to Your BI Tool
Once your dashboard wireframe is ready, use the BI Tool Export feature to send it directly to Power BI or Tableau for further analysis and enhancements. You can also download the dashboard as a PDF, PNG, or JPEG, embed it on a platform, or invite your team to collaborate.
Note: This is a Pro template. You’ll need a Pro subscription on Mokkup to use and customize this dashboard wireframe. Upgrade anytime to unlock full access.
Dermatology Center Diagnostics & Laboratory Dashboard Example
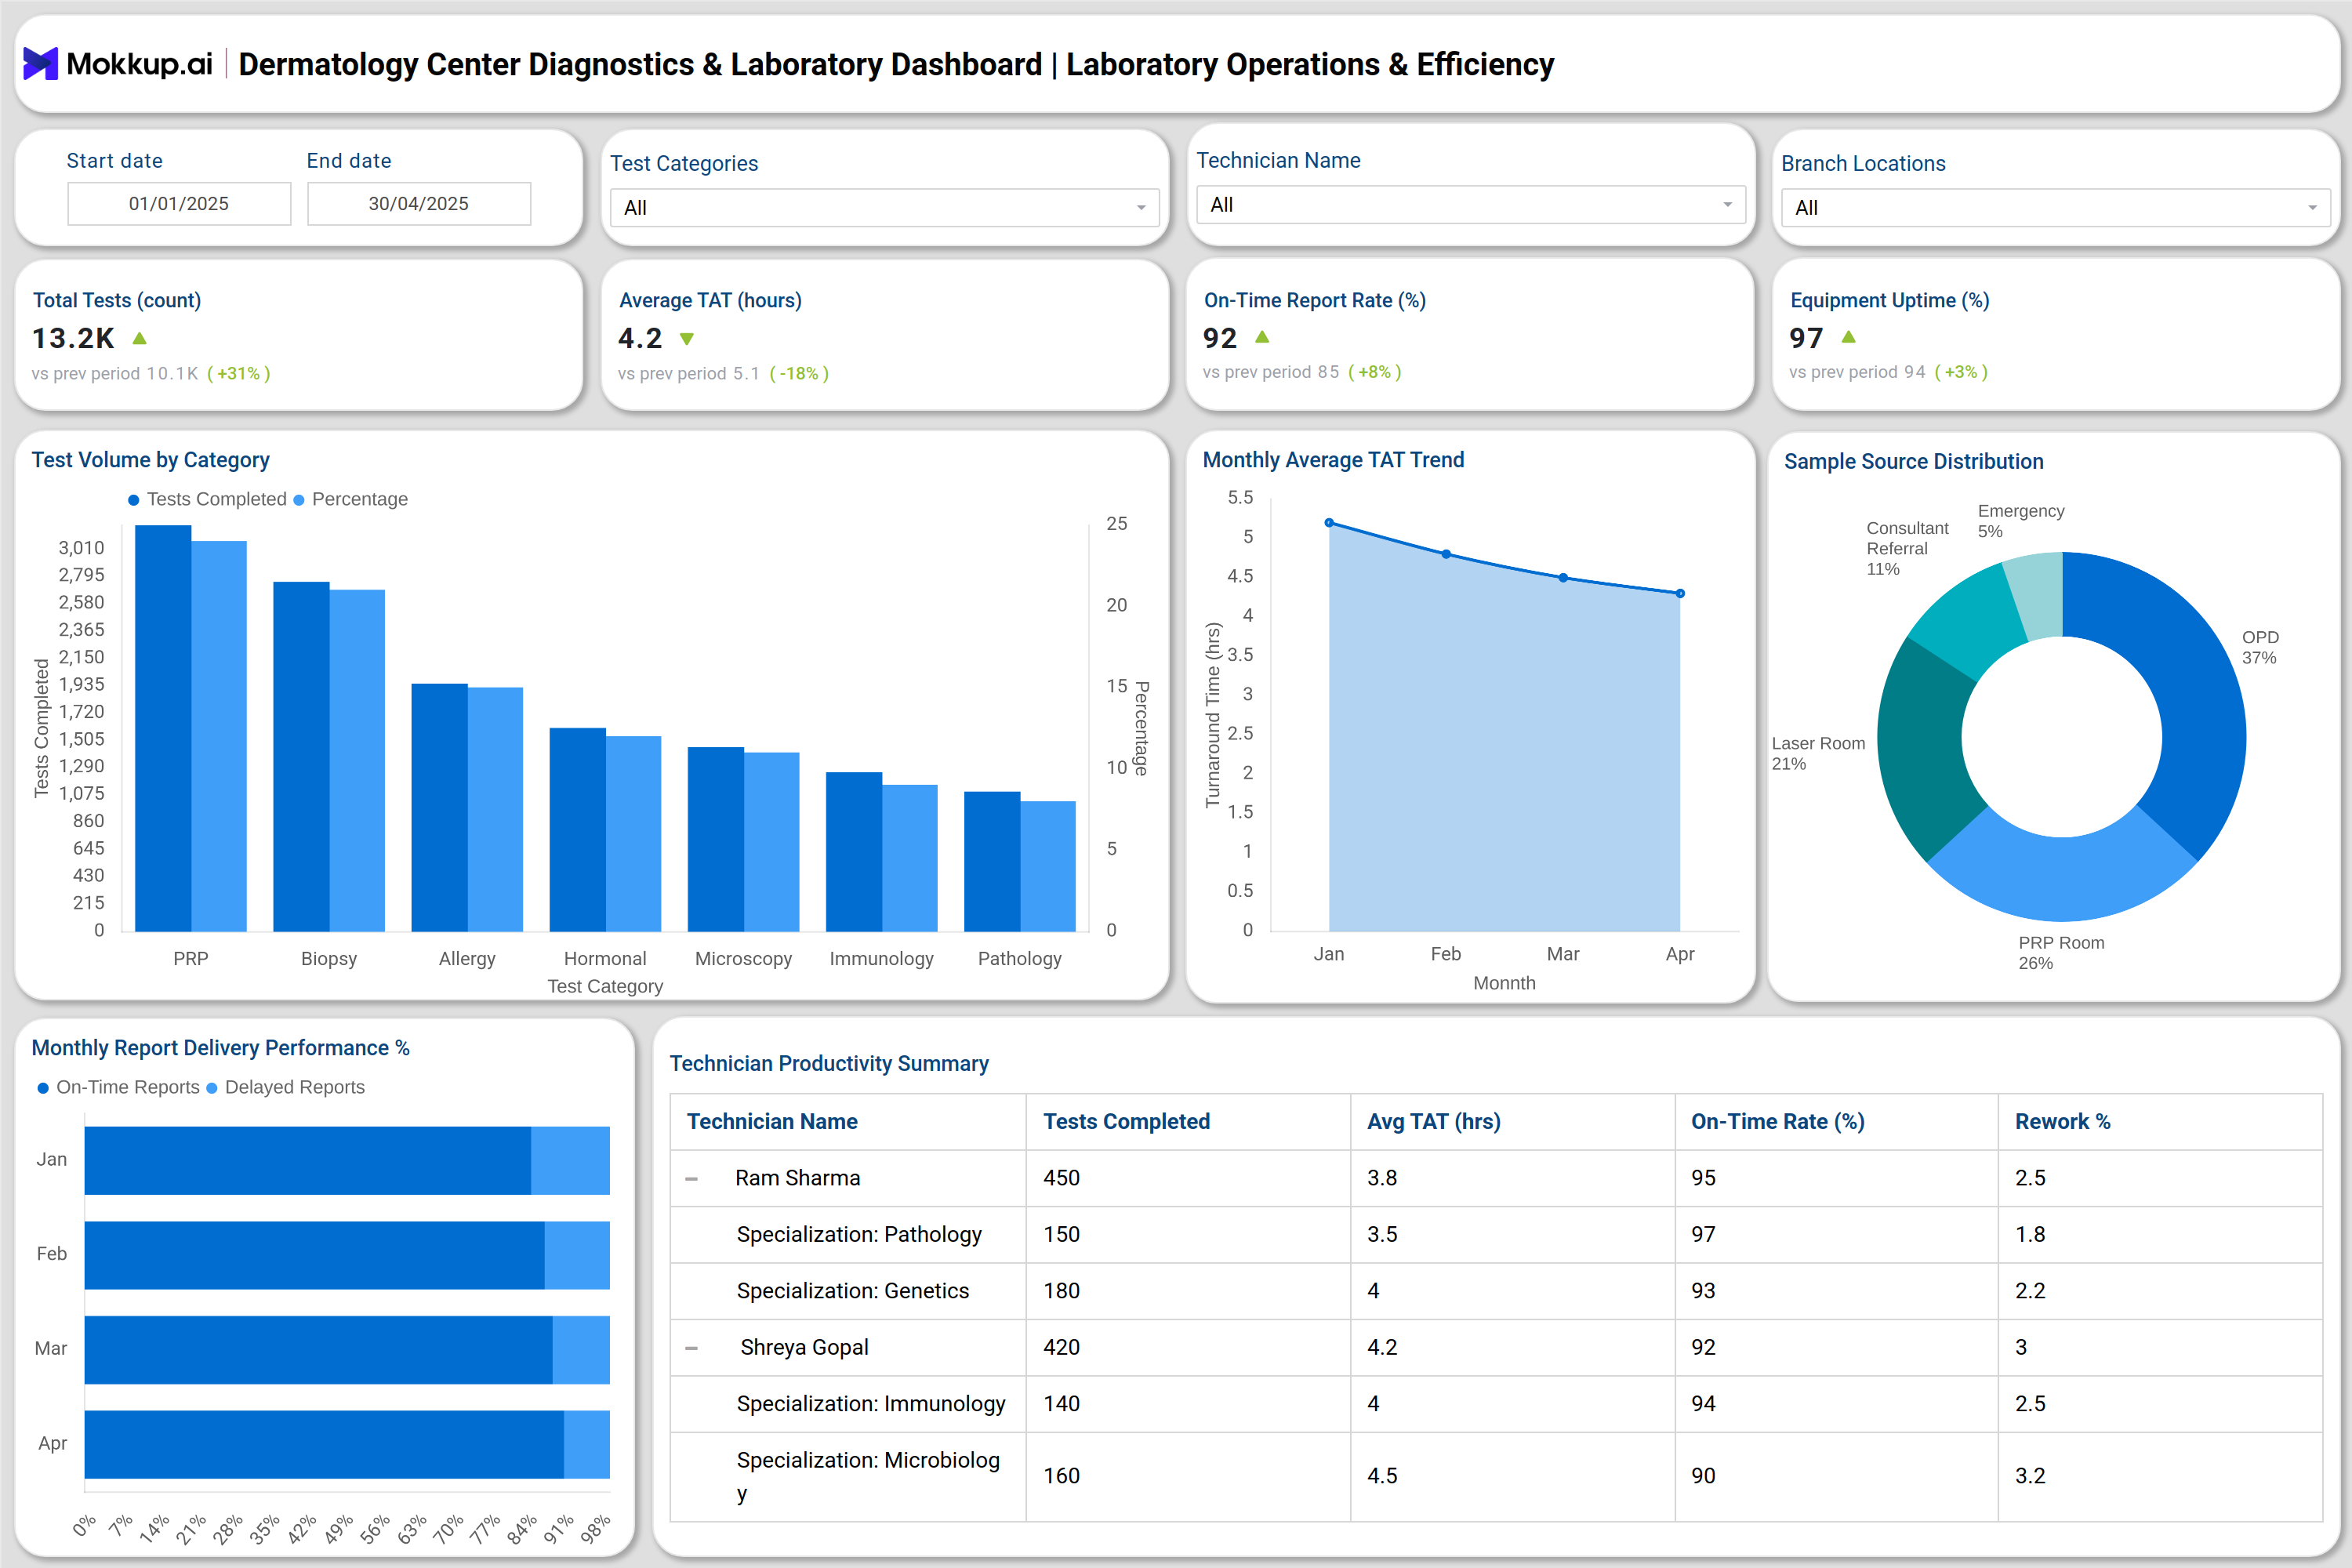
You can create your own Dermatology Center Diagnostics & Laboratory Dashboard by combining modules that track financial, operational, and quality metrics in a single, integrated view. The dashboard includes three key sections: the Laboratory Operations & Efficiency Dashboard, which monitors test volumes, turnaround times (TAT), technician productivity, and equipment uptime; the Test Quality & Compliance Monitoring Dashboard, which tracks QC pass rates, EQA performance, calibration compliance, and safety audits for regulatory standards; and the Financial & Business Performance Dashboard, which analyzes revenue trends, cost distribution, profit margins, and referral conversions. Together, this Real-time dermatology lab dashboard offers a complete 360° view of performance, enabling data-driven decision-making and continuous improvement across diagnostic operations.
How to Analyze Data in a Dermatology Center Diagnostics & Laboratory Dashboard
Here is how you can analyze data from this dashboard wireframe:
- Track Test Efficiency: Measure daily and monthly test volumes and identify workload patterns by category.
- Monitor Turnaround Times: Utilize TAT trends to evaluate laboratory performance and minimize reporting delays.
- Evaluate Technician Productivity: Review completed tests, rework rates, and on-time delivery percentages.
- Assess Equipment Reliability: Track uptime rates and maintenance schedules to minimize test disruptions.
- Audit Quality Compliance: Analyze QC pass rates, EQA scores, and reagent or calibration incidents.
- Monitor Financial Health: Compare revenue and cost distribution per test to improve profitability.
- Optimize Referrals: Review referral conversion rates and income generated per referring doctor.
- Ensure Safety & Compliance: Track non-conformities, reagent expiries, and safety audit performance.
Benefits of a Dermatology Center Diagnostics & Laboratory Dashboard
Benefits of implementing this dashboard are:
- Centralized Data Management: Consolidates all diagnostic, operational, and financial data in one visual platform.
- Improved Operational Efficiency: Identifies bottlenecks in turnaround times, technician workload, and equipment use.
- Accurate Quality Monitoring: Ensures continuous compliance with NABL and CAP standards through automated QC and EQA tracking.
- Enhanced Financial Oversight: Supports revenue optimization through data-driven pricing and tests profitability analysis.
- Real-time Reporting: Provides actionable insights instantly with Dermatology laboratory data analytics.
- Reduced Error Rates: Detects anomalies in reports, samples, or reagent usage early.
- Informed Strategic Decisions: Helps lab administrators plan staffing, equipment investments, and service improvements.
- Improved Patient Satisfaction: Ensures timely and reliable diagnostic results through streamlined processes that ensure quality clinical care.
KPIs to Track in a Dermatology Center Diagnostics & Laboratory Dashboard
- Total Tests Conducted (#): Number of tests performed during a defined period.
- Average Turnaround Time (TAT): Hours taken to complete and report a test.
- On-Time Report Delivery (%): Percentage of reports completed within SLA.
- Equipment Uptime (%): Percentage of total operational time of diagnostic machines.
- Calibration Compliance (%): Percentage of equipment calibrated within schedule.
- Revenue per Test (₹): Average revenue generated per diagnostic test.
These KPIs transform the dashboard into a dermatology test result tracking dashboard, ensuring visibility into every layer of laboratory performance.
Frequently Asked Questions
1. What is the purpose of a Dermatology diagnostic lab dashboard?
It provides real-time insights into lab operations, financial metrics, and quality standards to improve productivity, profitability, and compliance.
2. How often should the dashboard data be updated?
For accuracy, it should be refreshed daily or integrated in real time with LIS and financial systems.
3. Who uses this dashboard?
Lab directors, hospital administrators, quality managers, and finance teams use it for operations, compliance, and decision-making.