What is a Dental Hospital Patient Safety & Quality Dashboard?
A Dental Hospital Patient Safety & Quality Dashboard is a centralized tool designed for hospital leadership to monitor overall performance in real time, including medical directors, quality officers, and board members. It provides visibility into patient safety incidents, post-procedure complications, infection rates, treatment success, compliance with safety protocols, staff training, and patient satisfaction.
Unlike static reports, this dashboard acts as a real-time patient safety and quality performance dashboard, helping dental institutions track operational safety, clinical outcomes, and patient care quality in one place.
How to Create a Dental Hospital Patient Safety & Quality Dashboard
You don’t need to build your report from scratch—just start with a ready-to-use Eye hospital overview dashboard template from Mokkup. Add in your data and export it however you like. Here’s how to do it:
1. Create or Log in to Your Mokkup Account
Start by signing up on Mokkup.ai using your email. If you already have an account, just log in, and you’ll be good to go.
2. Choose and Customize Your Dashboard Template
Find the Eye Hospital Overview Dashboard template in the Templates section. Use the drag-and-drop editor to adjust KPIs, edit filters, or add elements based on your data.
3. Export to Your BI Tool
Once your dashboard wireframe is ready, use the BI Tool Export feature to send it directly to Power BI or Tableau for further analysis and enhancements. You can also download the dashboard as a PDF, PNG, or JPEG, embed it on a platform, or invite your team to collaborate.
Note: This is a Pro template. You’ll need a Pro subscription on Mokkup to use and customize this dashboard wireframe. Upgrade anytime to unlock full access.
Dental Hospital Patient Safety & Quality Dashboard Example
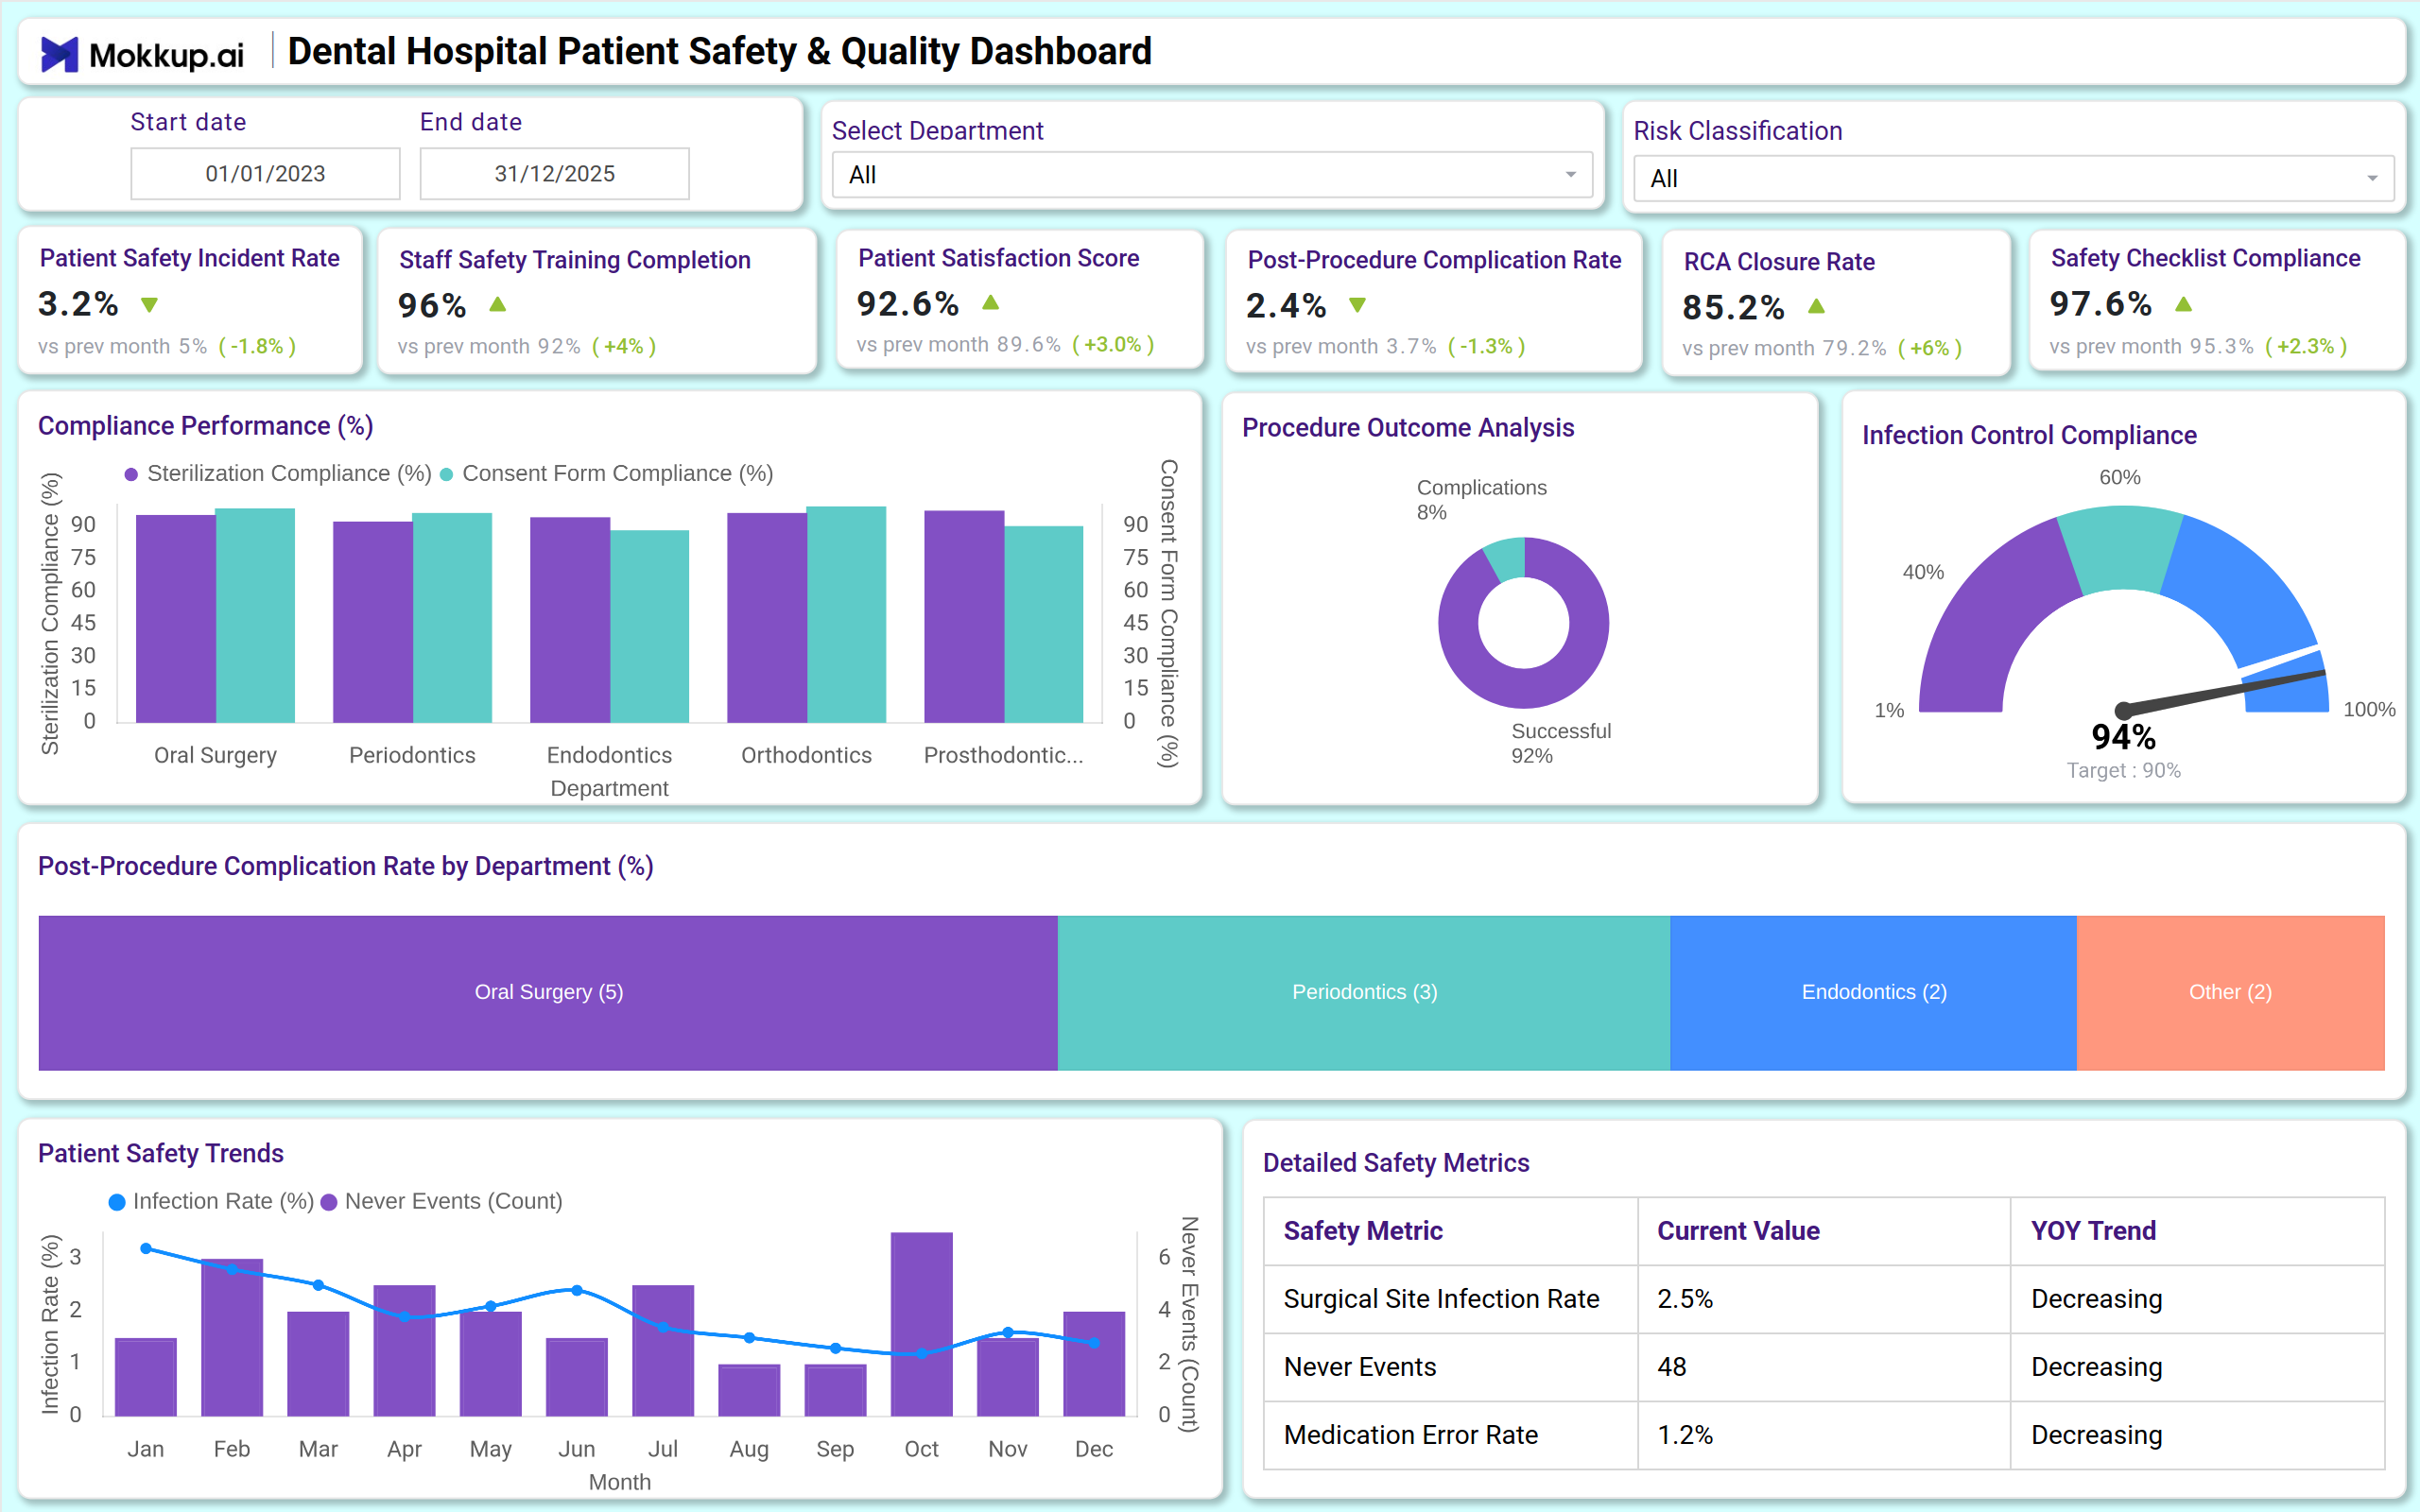
You can create a Dental Hospital Patient Safety & Quality Dashboard with a mix of KPI cards and visualizations. Track key metrics such as patient safety incident rate, infection control compliance analytics, post-procedure complications, RCA closure Rate, treatment success rate, staff training completion, and consent form compliance.
For trends and department analysis, line and bar charts show incident trends over time, department-wise complication rates, and procedure-specific risk areas. Tree maps, gauges, and bar charts further display patient satisfaction scores, staff safety training, and root cause analysis closure status.
Together, these elements work as a comprehensive dashboard for tracking dental patient safety and quality, ensuring leadership gets both clinical and operational visibility.
How to Analyze Data in Dental Hospital Patient Safety & Quality Dashboards
Here’s how the Dental Hospital patient safety dashboard can be analyzed to maximize its usage:
- Track patient safety incidents: Use line charts to monitor incident rates and post-procedure complications over time.
- Monitor departmental risk: Tree maps and bar charts show high-risk departments and procedure types.
- Review protocol compliance: Gauge charts track safety checklist completion, sterilization adherence, and consent form compliance.
- Evaluate staff readiness: Track training completion to ensure all staff are equipped with up-to-date safety knowledge.
- Assess patient experience: Monitor satisfaction scores and feedback trends related to safety and care quality.
- Measure RCA effectiveness: Track Root Cause Analysis closure rates to see how quickly safety issues are resolved.
Benefits of Dental Hospital Patient Safety & Quality Dashboards
- Improved visibility: Real-time KPIs across patient safety, clinical outcomes, and quality compliance.
- Operational efficiency: Tracks post-procedure complications and departmental performance for better resource allocation.
- Patient safety monitoring: Monitors infection rates, medication errors, and never events for proactive interventions.
- Evidence-based decision making: RCA insights and protocol compliance data help improve processes.
- Enhanced patient experience: Tracks satisfaction and treatment success to maintain high-quality care in the dental clinics.
- Compliance & reporting: Supports accreditation audits (NABH, JCI) and governance by providing a transparent safety overview.
Together, these elements provide leadership with clinical and operational visibility, making treatment success & complication monitoring easy. That’s why many healthcare leaders call it the best Dental hospital patient safety and quality dashboard when scaling efficiency and care standards.
KPIs to Track in Dental Hospital Patient Safety & Quality Dashboards
- Patient Safety Incident Rate (%) – % of patients experiencing safety incidents.
- Post-Procedure Complication Rate (%) – % of patients with complications per procedure or department.
- Infection Control Compliance (%) – % adherence to sterilization and hygiene protocols.
- RCA Closure Rate (%) – % of incidents fully investigated and closed.
- Treatment Success Rate (%) – % of procedures achieving intended clinical outcomes.
- Safety Checklist Compliance (%) – % of procedures following all safety steps.
- Consent Form Compliance (%) – % of patients with complete consent forms.
- Staff Training Completion (%) – % of staff trained in safety protocols.
Frequently Asked Questions
1. Who should use a Dental Hospital Patient Safety & Quality Dashboard?
Medical directors, Quality managers, and trustees responsible for patient safety strategy and performance monitoring.
2. Can this dashboard help improve clinical outcomes?
Yes. Leadership can proactively identify high-risk areas, monitor compliance, and reduce post-procedure complications.
3. How does it support patient care quality?
It combines safety KPIs like infection rates and incident monitoring with operational efficiency to ensure high standards of care.
4. Is this dashboard useful for compliance?
Yes. The dashboard supports accreditation and regulatory reporting, providing governance-ready insights.