What is a Court Services Dashboard?
A Court Services Dashboard is a digital reporting tool designed to track how citizens interact with court services and how efficiently those services are delivered. It brings together inquiries, resolution rates, waiting times, filing channels, and customer satisfaction metrics into one central platform. For public access departments, this type of dashboard acts as a government service performance tracking tool. It helps managers monitor how quickly inquiries are resolved, whether service-level agreements (SLAs) are being met, and how well courts are adopting digital filing and self-service tools. By consolidating data into a clear, functional interface, courts gain real-time insight into service performance and citizen satisfaction.
How to Create a Court Services Dashboard
You don’t need to build your report from scratch—just start with a ready-to-use Court clerical operations or service template from Mokkup. Add in your data and export it however you like. Here’s how to do it:
1. Create or Log in to Your Mokkup Account
Start by signing up on Mokkup.ai using your email. If you already have an account, just log in, and you’ll be good to go.
2. Choose and Customize Your Dashboard Template
Find the Court Services Dashboard template in the Templates section. Use the drag-and-drop editor to adjust KPIs, edit filters, or add elements based on your data.
3. Export to Your BI Tool
Once your dashboard wireframe is ready, use the BI Tool Export feature to send it directly to Power BI or Tableau for further analysis and enhancements. You can also download the dashboard as a PDF, PNG, or JPEG, embed it on a platform, or invite your team to collaborate.
Note: This is a Pro template. You’ll need a Pro subscription on Mokkup to use and customize this dashboard wireframe. Upgrade anytime to unlock full access.
Court Services Dashboard Example
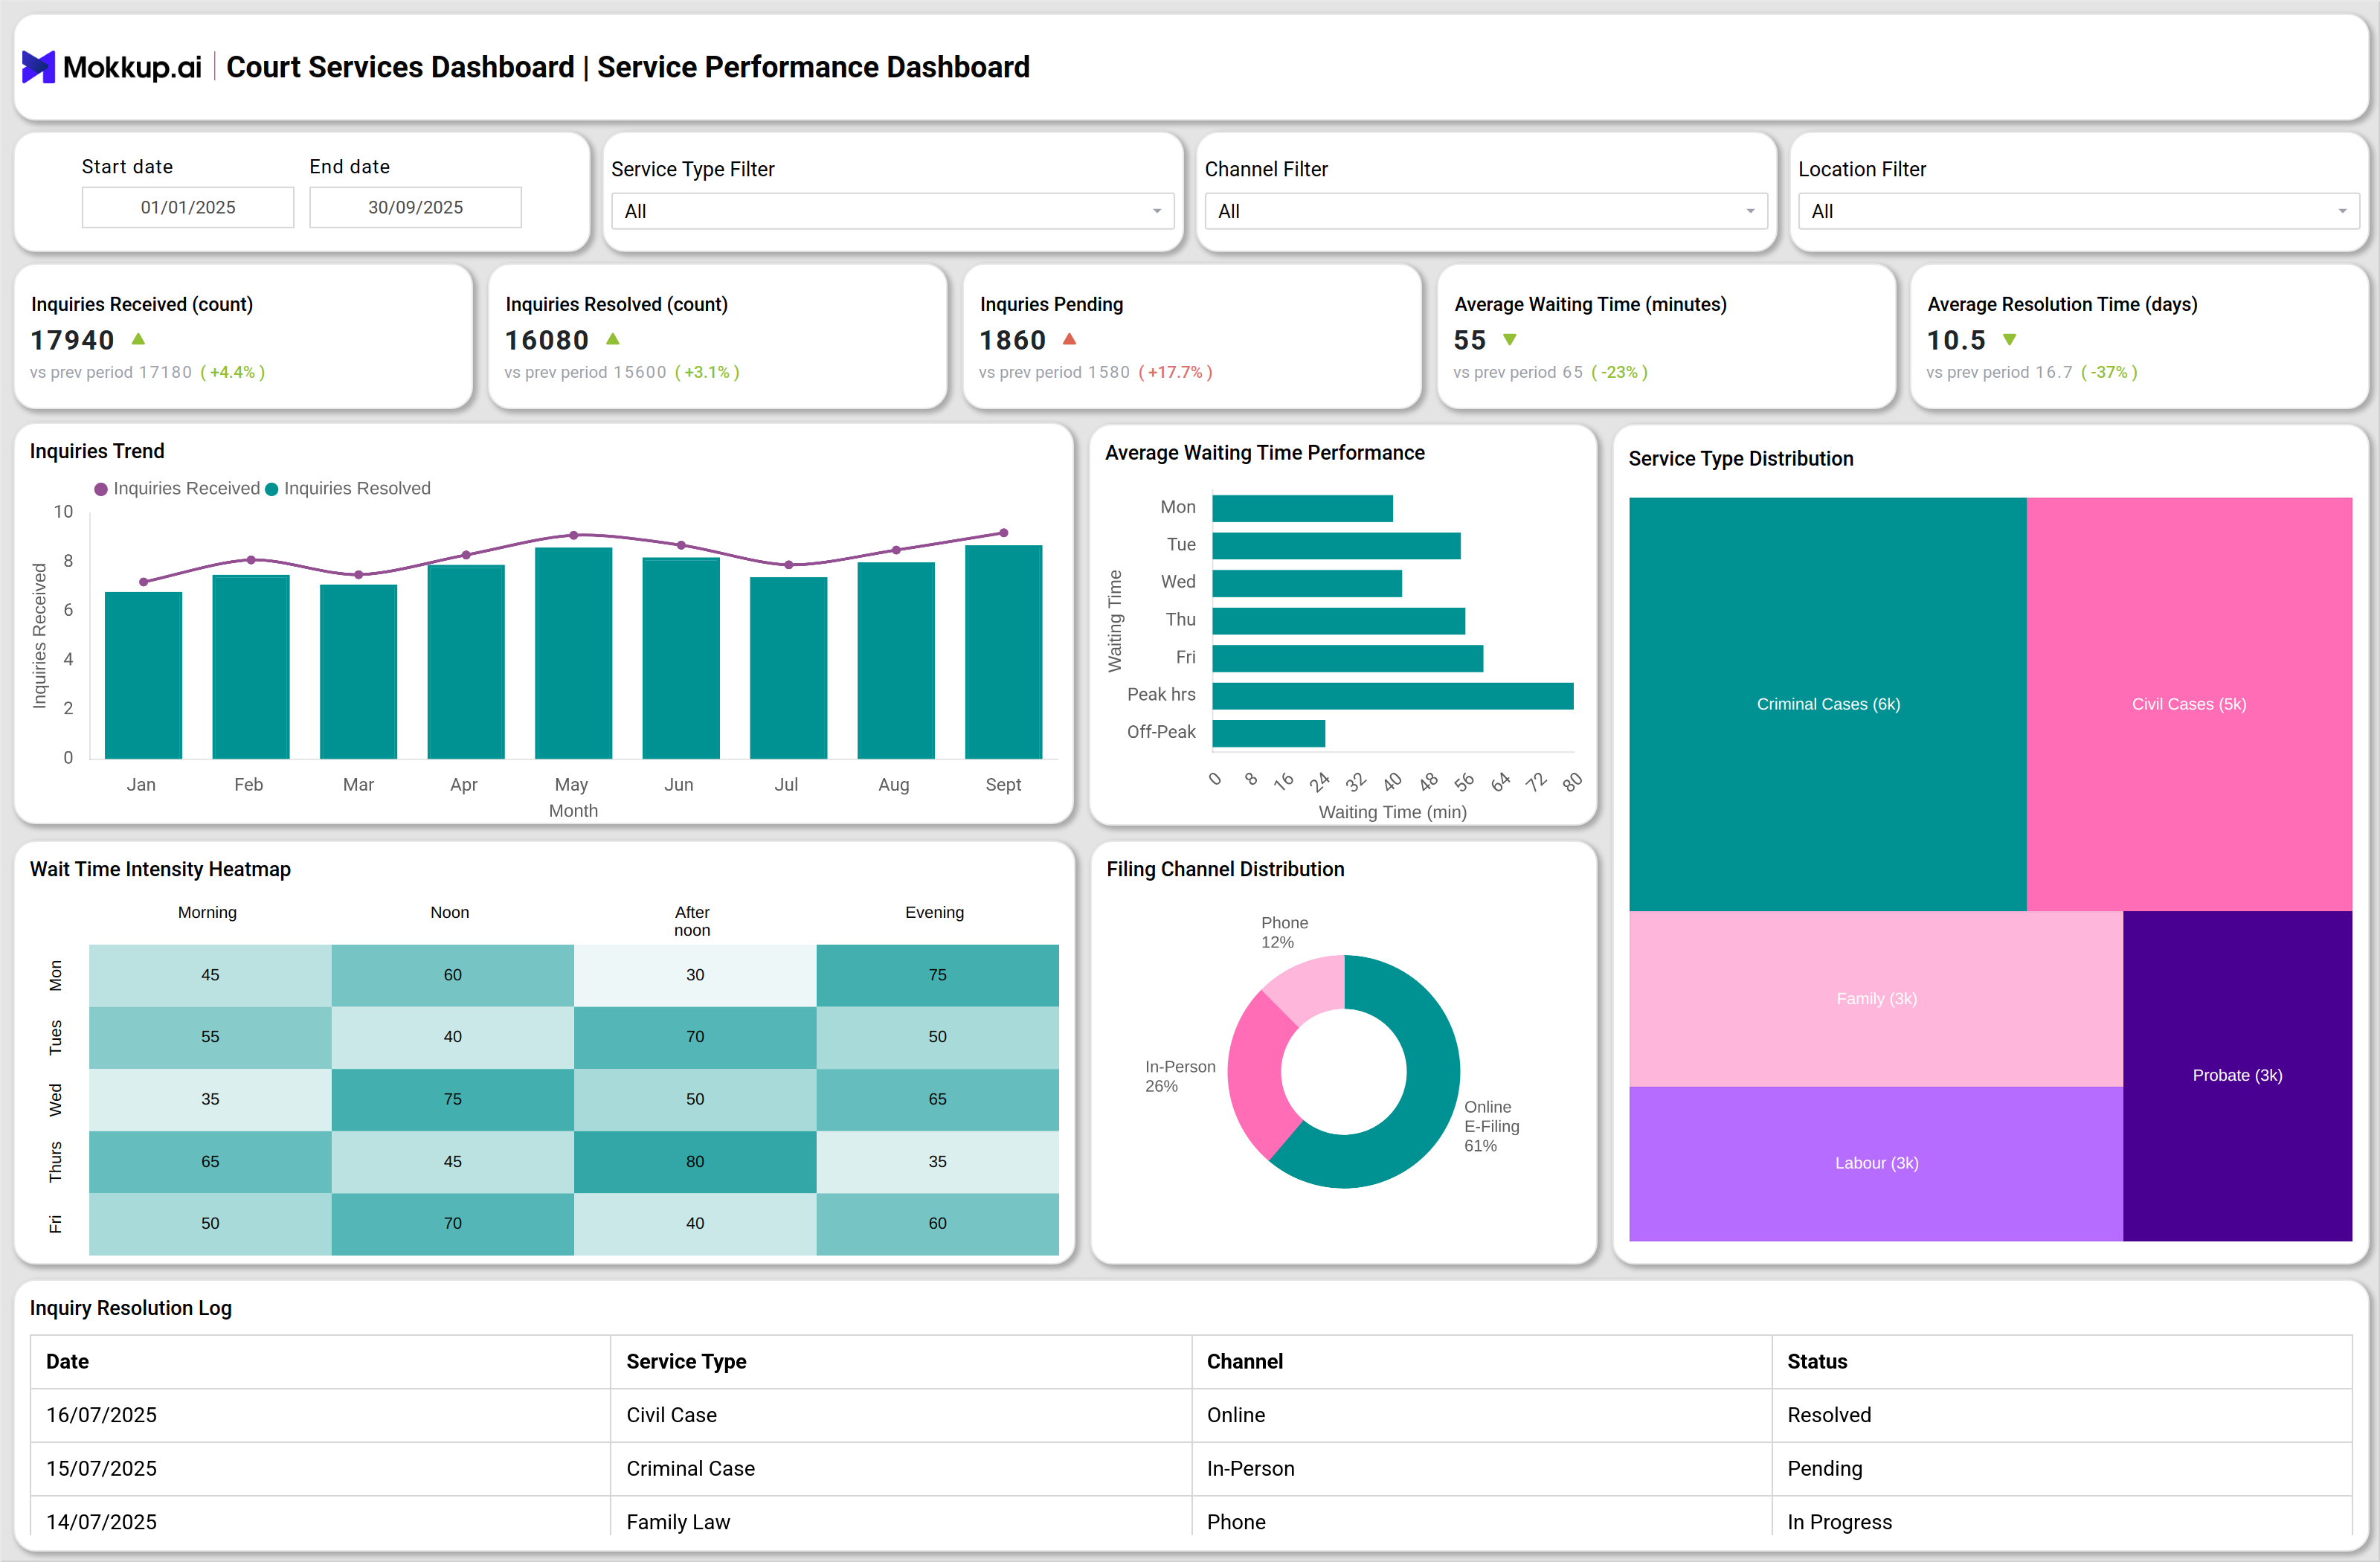
Create your personalized Court Services Dashboard to track both operational performance and citizen engagement in real time. The Service Performance Overview section highlights inquiries received and resolved, average waiting times, digital filing adoption, and customer satisfaction, with visuals like line and column charts, heatmaps, and treemaps to reveal trends and bottlenecks. The Public Engagement & Satisfaction section provides deeper insights into citizen experience by monitoring feedback volume, overall satisfaction scores, complaint escalation rates, and feedback channel distribution through bar charts, pie charts, and detailed complaint management tables. Together, these views transform the dashboard into a court services dashboard for public access, making it an essential government service performance tracking tool for improving efficiency and transparency.
How to Analyze Data in Court Services Dashboards
When reviewing a digital adoption in court service dashboards, analysis should be methodical. To effectively use the Court Services Dashboard, follow these steps:
- Track the number of inquiries received and resolved to measure overall service efficiency and identify potential backlog risks.
- Review waiting time for services against SLA targets to detect delays and ensure citizens are served promptly.
- Analyze online e-filing usage rates to assess the adoption of digital tools compared to traditional in-person submissions.
- Monitor customer satisfaction scores alongside service metrics to evaluate the overall citizen experience.
- Compare inquiry resolution and waiting times across different periods to highlight improvements or recurring issues.
- Correlate e-filing adoption with satisfaction levels to see how digital services impact convenience and trust.
- Benchmark current performance against previous months or years to measure progress in reducing delays and increasing efficiency.
By analyzing data this way, courts can streamline operations, encourage digital adoption, and deliver faster, more citizen-friendly services.
Benefits of Court Services Dashboards
Implementing a court service efficiency and satisfaction metrics dashboard offers several benefits:
- Operational Transparency: Clear visibility into inquiries, waiting times, and resolution performance.
- Enhanced Citizen Engagement: Direct tracking of satisfaction levels and complaints through a citizen engagement and complaint management system.
- Digital Transformation Tracking: Measures adoption of online filing and self-service completion.
- Bottleneck Detection: Identifies delays and peak workload periods through wait-time analysis.
- Performance Accountability: Provides a measurable framework for service improvement.
- Data-Driven Resource Allocation: Aligns staffing and scheduling with demand patterns.
- Continuous Improvement: Tracks KPIs that guide policy decisions and service reforms.
KPIs to Track in Court Services Dashboards
A strong Clerical Service Dashboard tracks key KPIs including:
- Inquiries Received and Resolved: Tracks service demand and efficiency.
- Pending Inquiries: Identifies growing backlogs.
- Average Waiting Time: Measures compliance with SLA thresholds.
- Online E-Filing Usage Rate: Evaluates digital service adoption.
- Customer Satisfaction Score (CSAT): Core measure of public perception.
- Feedback Volume: Tracks how often citizens engage with feedback channels.
Frequently Asked Questions
1. What is the purpose of a Court Services Dashboard?
It helps courts monitor inquiry handling, waiting times, satisfaction scores, and complaint resolution in real time.
2. Who can use this dashboard?
Court administrators, public service managers, and leadership teams overseeing citizen-facing operations can use this dashboard to streamline work.
3. How does it improve citizen satisfaction?
It improves citizen satisfaction by tracking wait times, feedback, and escalations. In otherr words, it provides a framework to address citizen concerns quickly.