What is a Content Consumption & Adoption Dashboard?
A Content Consumption & Adoption Dashboard is a data visualization tool designed to track how audiences engage with digital content across platforms. It helps teams monitor metrics such as post views, returning viewers, scroll depth, and bounce rates for a comprehensive overview of content performance. Marketers and content creators use these dashboards to understand user behavior and optimize content strategies.
How to Create a Content Consumption & Adoption Dashboard
You don’t need to build your report from scratch—just start with a ready-to-use dashboard template from Mokkup. Add in your data and export it however you like. Here’s how to do it:
1. Create or Log in to Your Mokkup Account
Start by signing up on Mokkup.ai using your email. If you already have an account, just log in, and you’ll be good to go.
2. Choose and Customize Your Dashboard Template
Find the Content Consumption & Adoption Dashboard in the Templates section. Use the drag-and-drop editor to adjust KPIs, edit filters, or add elements based on your data.
3. Export to Your BI Tool
Once your dashboard wireframe is ready, use the BI Tool Export feature to send it directly to Power BI or Tableau for further analysis and enhancements. You can also download the dashboard as a PDF, PNG, or JPEG, embed it on a platform, or invite your team to collaborate.
Note: This is a Pro template. You’ll need a Pro subscription on Mokkup to use and customize this dashboard wireframe. Upgrade anytime to unlock full access.
Content Consumption & Adoption Dashboard Example
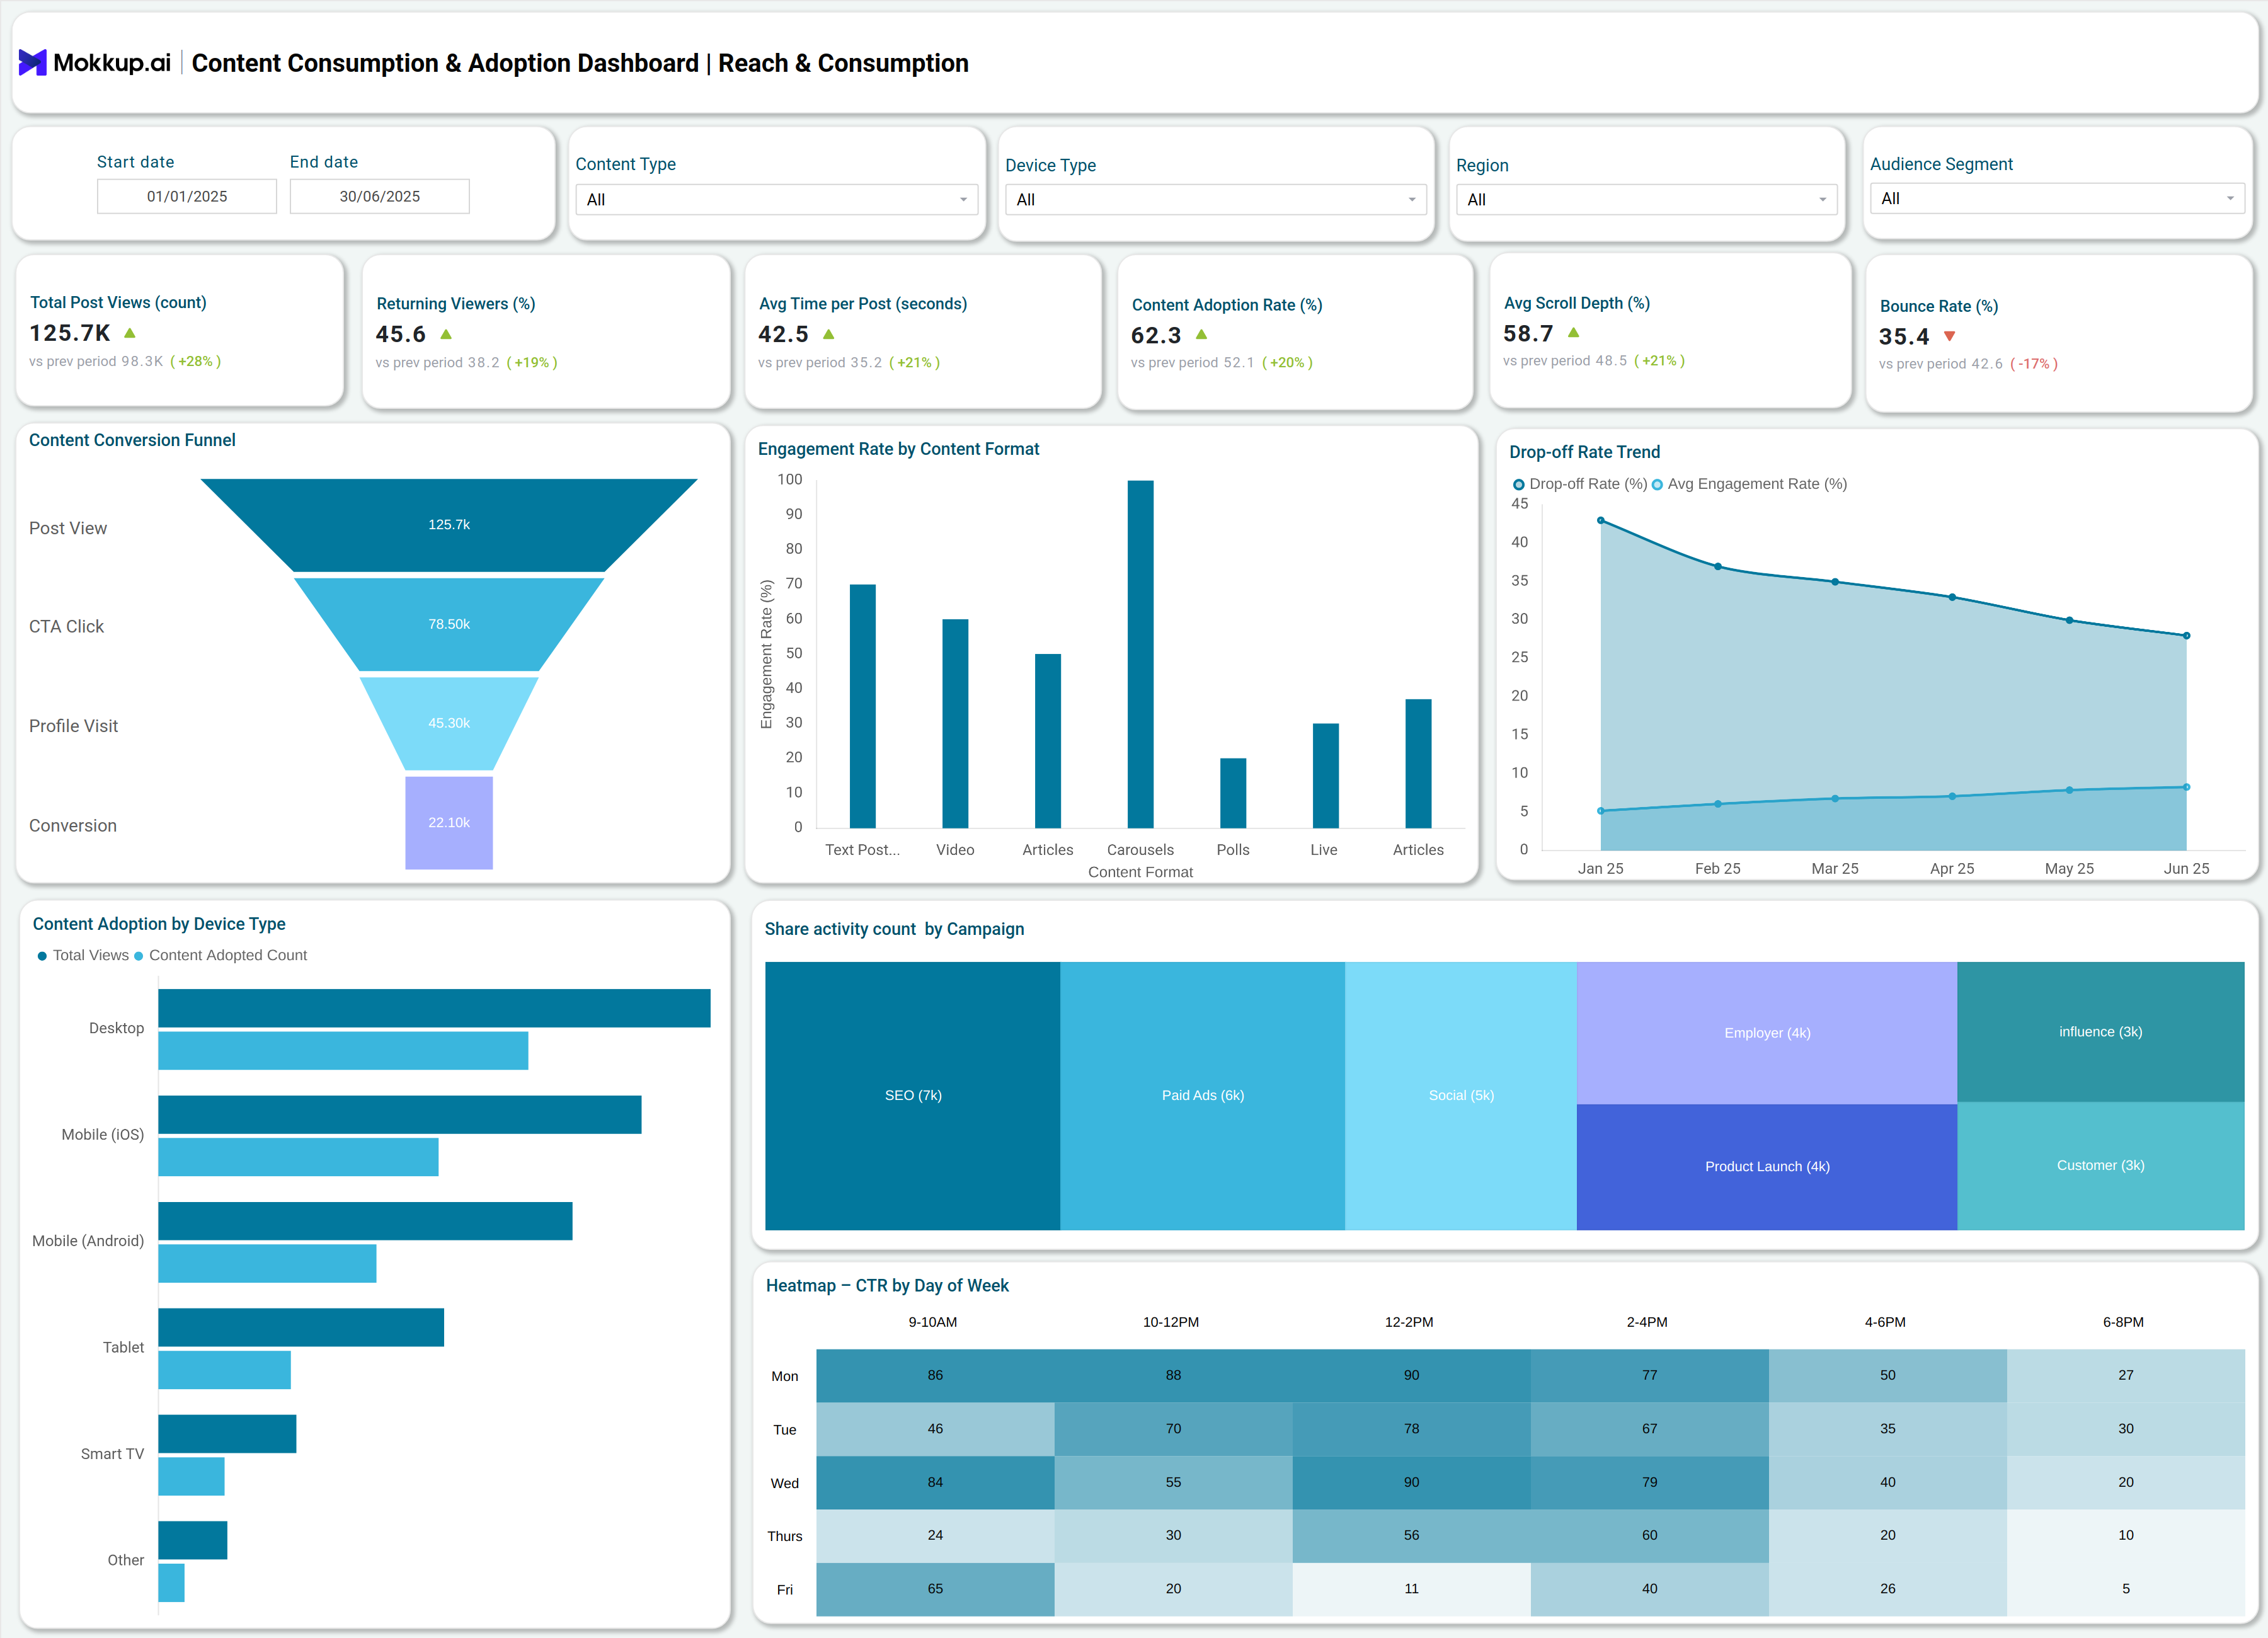
The Content consumption dashboard highlights content engagement over a defined period, offering a clear view of how users interact with content. Key content adoption metrics tracked include total post views, average time spent per post, returning viewers, content adoption rate, average scroll depth, and bounce rate. To make these insights actionable, the dashboard uses visualizations such as funnel charts, drop-off trend lines, and traffic-to-conversion paths, which illustrate the journey from view to conversion, identify user drop-off points, and reveal the sources driving conversions. Additionally, engagement rates are broken down by content format, making it easier to assess the performance of videos, articles, carousels, and other formats to determine which types resonate most effectively with the audience
How to Analyze Data in Content Consumption & Adoption Dashboards
1. Start with core KPIs:
- Total views - measure reach
- Returning viewer % - measure retention
2. Content consumption:
- Content adoption rate
- Average scroll depth - shows how thoroughly content is consumed
3. Funnel analysis:
- Track drop-offs across stages (post-view CTA click-profile visit-conversion)
- Focus on high drop-off points and optimize content/CTAs
4. Trend tracking: monitor changes over time and compare across audience segments
5. Engagement by format: analyze text, video, carousel, etc., to see which drives most interactions
6. Traffic source segmentation: organic, paid, referral -compare conversion effectiveness
7. Bounce rate: flag content needing stronger engagement strategies
Benefits of Content Consumption & Adoption Dashboards
Implementing Content performance tracking delivers several advantages:
- Centralized Monitoring: All engagement and conversion data is accessible in one interface, enabling informed decisions to be made rapidly.
- Real-time Insights: Immediate feedback on what content works allows quick adjustments for improved ROI.
- Data-driven Strategy: KPIs guide content optimization, audience targeting, and resource allocation.
- Conversion Focus: Funnel and traffic analysis visualize bottlenecks, supporting more effective conversion rate improvements.
- Audience Understanding: Granular segmentation by device, region, and segment supports tailored content strategies.
KPIs to Track in Content Consumption & Adoption Dashboards
Critical KPIs in this Digital content adoption dashboard template include:
- Total Post Views: Measures audience reach.
- Average Time per Post: Indicates engagement depth.
- Returning Viewers %: Shows retention and loyalty.
- Content Adoption Rate: Tracks the percentage of consumers consuming new content.
- Average Scroll Depth: Reveals how much content is viewed.
- Bounce Rate: Signals content or UX issues.
- Conversion Rate: Measures success in achieving objectives, from CTAs to purchases.
- Engagement Rate by Content Format: Shows which types of content drive interaction.
- Drop-off Rate Trend: Identifies where users exit the funnel.
- Traffic to Conversion Path: Maps conversion sources for marketing insights.
Frequently Asked Questions
1. What are the top metrics to monitor in a Content Consumption & Adoption Dashboard?
For a comprehensive assessment, focus on total views, returning viewers, scroll depth, adoption rate, bounce rate, and conversion rate.
2. How often should dashboard data be analyzed?
Based on recent trends, review performance weekly and after each major campaign for timely optimization.
3. Can this dashboard be customized for different content types?
Content format segmentation lets users analyze by video, articles, carousels, newsletters, and more for targeted insights.