
What is a Company Market Share Analysis Dashboard?
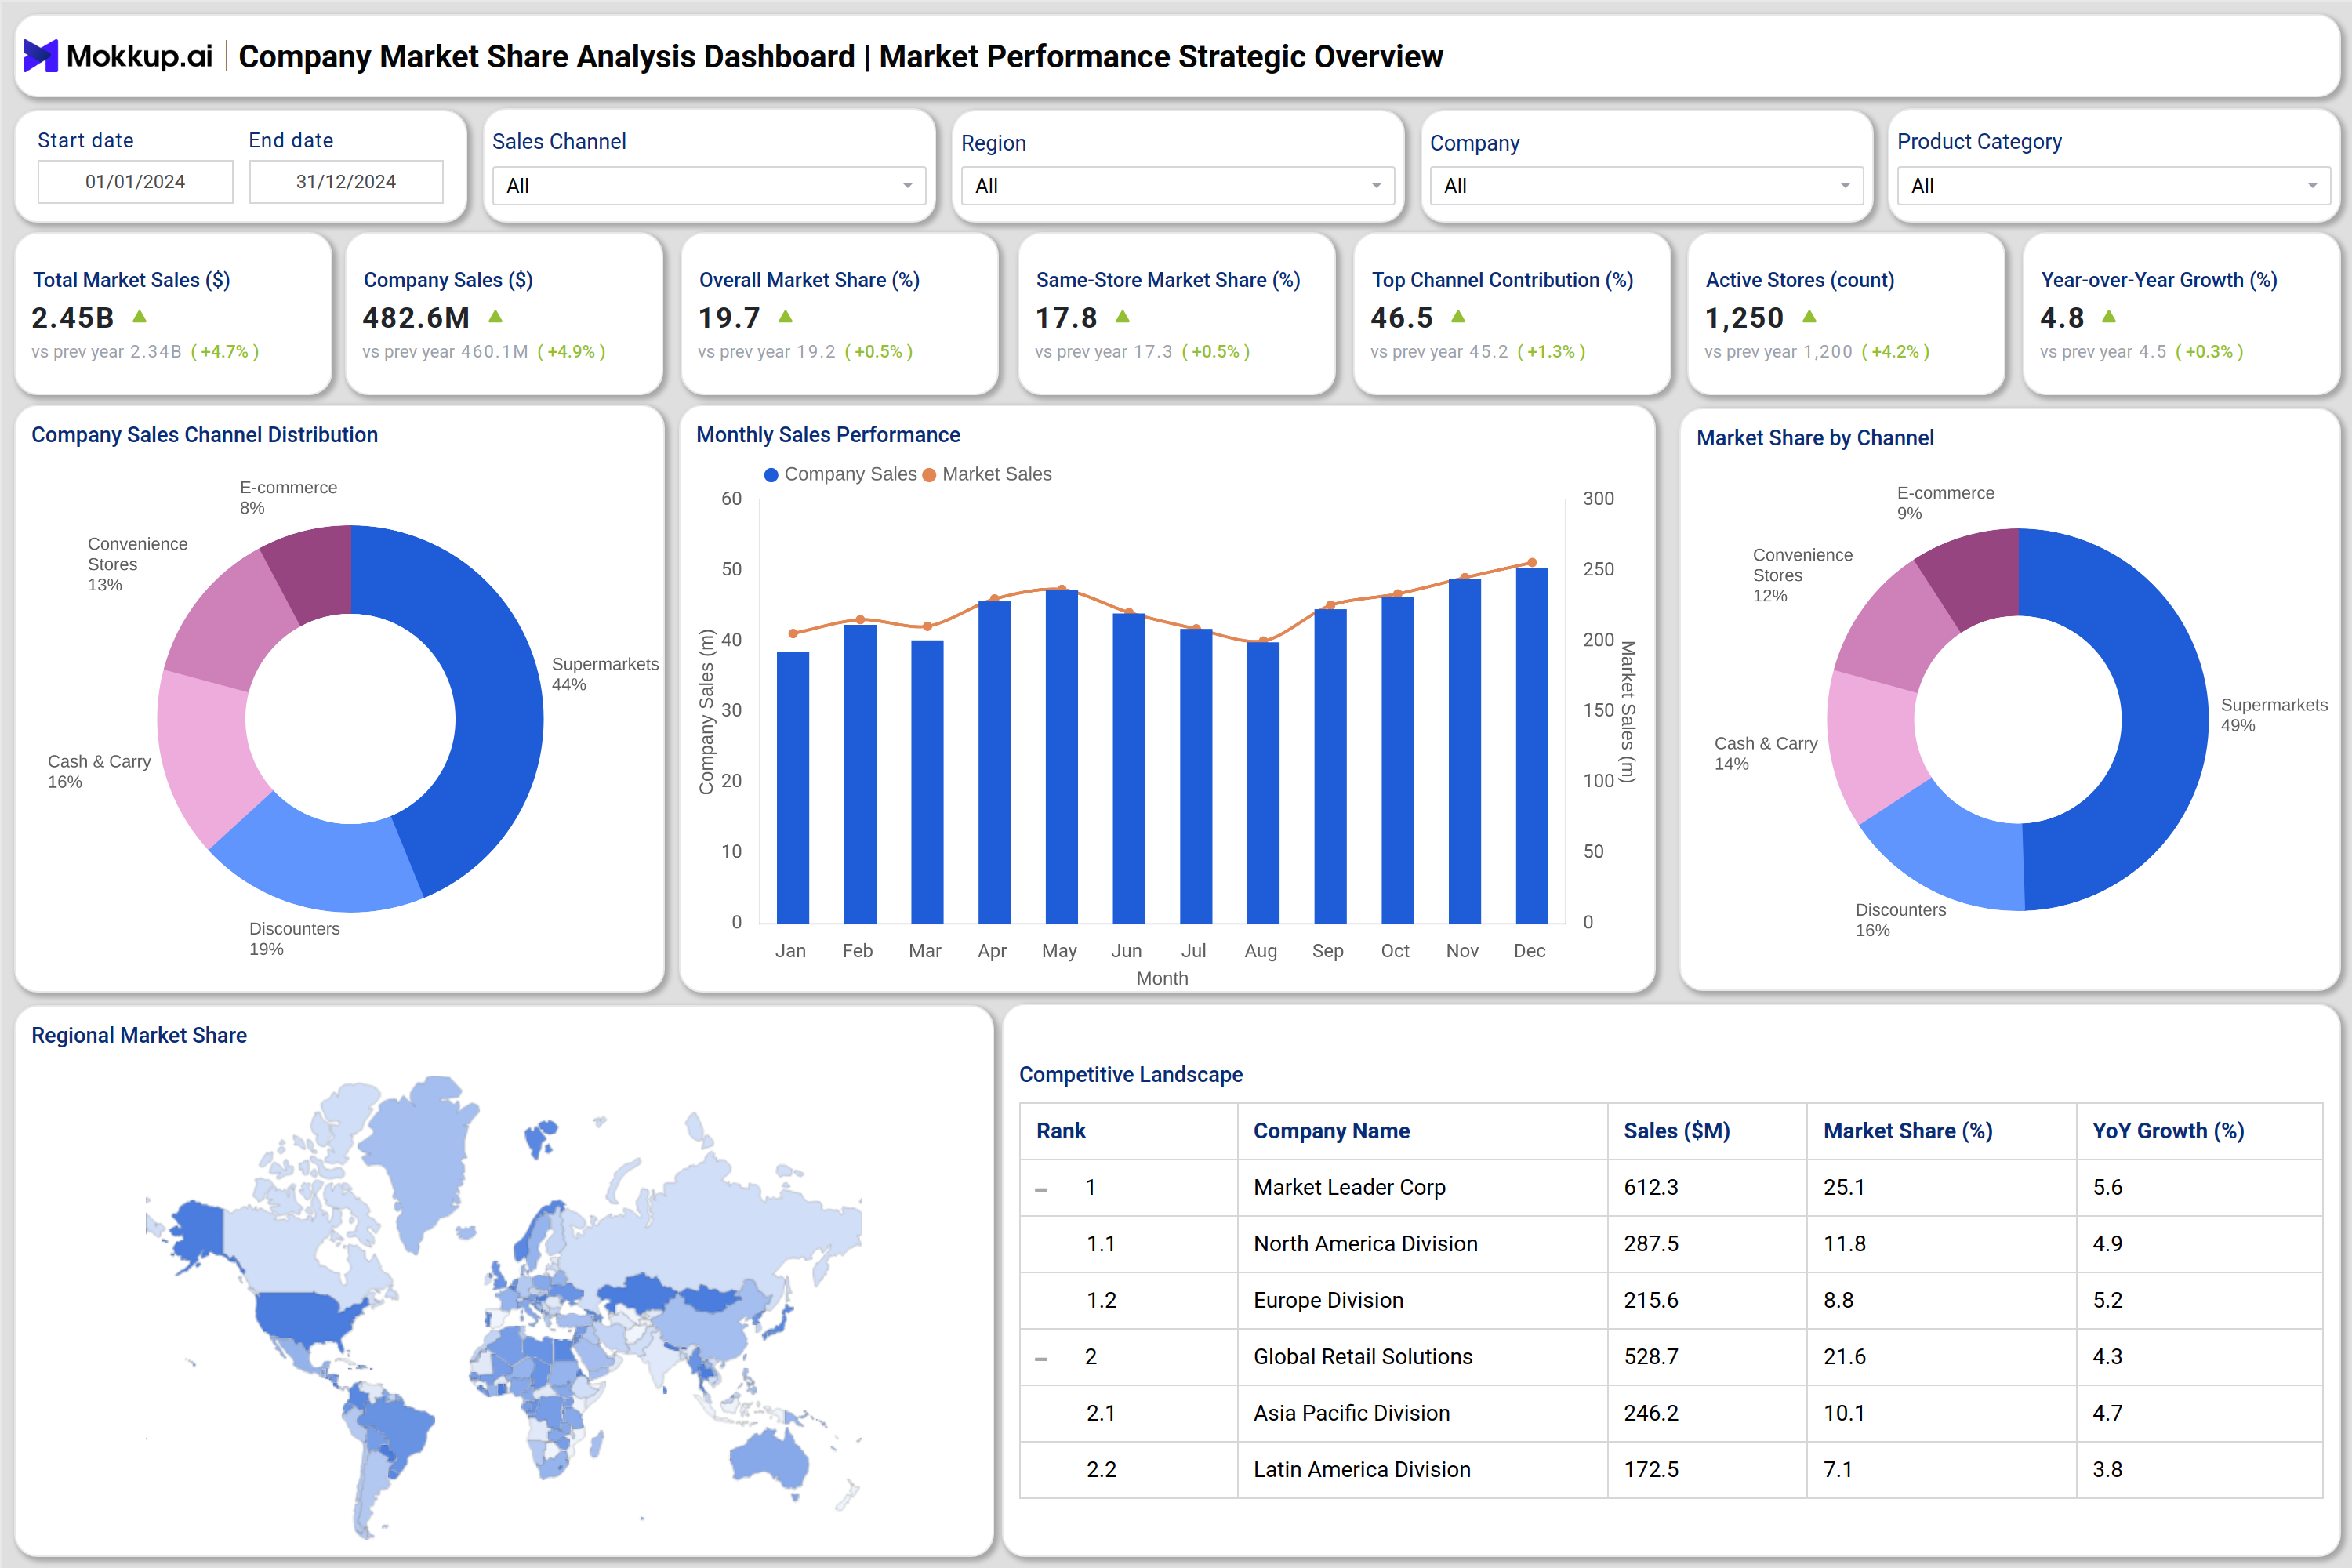
A Company Market Share Analysis Dashboard template helps organizations track their market position, assess competitive performance, and analyze revenue distribution across channels and regions. This market share analytics dashboard for companies consolidates key data on sales, growth, and competition into a single view, allowing decision-makers to monitor how their brand performs within the total market. The dashboard wireframe provides valuable insights into company sales share, same-store performance, channel contributions, and competitor rankings.
It acts as a competitive market share tracking dashboard platform, enabling leadership teams to make informed pricing, distribution, and marketing decisions. Designed for clarity and precision, it offers data visualization through trend charts, heatmaps, and performance tables to simplify complex market dynamics.
How to Create a Company Market Share Analysis Dashboard
You don’t need to build your report from scratch—just start with a ready-to-use Company Market Share Analysis dashboard template from Mokkup. Add in your data and export it however you like. Here’s how to do it:
1. Create or Log in to Your Mokkup Account
Start by signing up on Mokkup.ai using your email. If you already have an account, just log in, and you’ll be good to go.
2. Choose and Customize Your Dashboard Template
Find the Company Market Share Analysis Dashboard template in the Templates section. Use the drag-and-drop editor to adjust KPIs, edit filters, or add elements based on your data.
3. Export to Your BI Tool
Once your dashboard wireframe is ready, use the BI Tool Export feature to send it directly to Power BI or Tableau for further analysis and enhancements. You can also download the dashboard as a PDF, PNG, or JPEG, embed it on a platform, or invite your team to collaborate.
Note: This is a Pro template. You’ll need a Pro subscription on Mokkup to use and customize this dashboard wireframe. Upgrade anytime to unlock full access.
Company Market Share Analysis Dashboard Example
You can create your own Company Market Share Analysis Dashboard to monitor total market performance, track company growth, and analyze brand-level competitiveness. The first screen focuses on overall market share, comparing the company's sales against the total market and competitors. Charts like market vs. company sales trends, regional heatmaps, and channel-wise breakdowns highlight key strengths and underperforming areas. The second screen, Channel Performance Overview, dives deeper into sales by retail channel, such as supermarkets, discounters, or e-commerce, to evaluate contribution, growth drivers, and store-level performance.
Finally, the Brand and Competitor Performance screen provides a detailed brand-wise view of share distribution, growth trends, and positioning relative to competitors. It’s ideal for assessing portfolio efficiency and identifying opportunities for expansion or pricing adjustments. Together, these modules transform the dashboard into an enterprise market share performance review dashboard, delivering a comprehensive perspective of competitive dynamics and sales distribution.
How to Analyze Data in Company Market Share Analysis Dashboard
To effectively use the Company Market Share Analysis Dashboard, focus on comparing internal sales performance with overall market dynamics to evaluate competitiveness and growth:
- Track Overall Market and Company Sales: Compare total industry sales against company revenue to measure performance contribution.
- Assess Market Share Trends: Identify share changes over time to understand the impact of promotions or pricing shifts.
- Evaluate Channel Distribution: Analyze which sales channels, like supermarkets or online stores, generate the highest company share.
- Monitor Regional Performance: Use heatmaps to pinpoint high-performing regions and areas needing additional focus.
- Compare Competitors: Review the competitor ranking table to benchmark sales, share percentage, and growth performance.
- Drill Down by Brand: Assess how each brand contributes to the total company share and which ones lead or lag in growth.
- Analyze Same-Store Metrics: To understand long-term performance stability, evaluate sales and market share consistency across existing outlets.
Benefits of Company Market Share Analysis Dashboard
The Company Market Share Analysis Dashboard provides a clear view of competitive standing, enabling organizations to align strategy with market dynamics:
- Holistic Market Visibility: Combines internal and external data for a unified view of company and industry performance.
- Data-driven Decision-Making: Supports strategic planning with accurate share and growth insights.
- Real-Time Tracking: Monitors competitive shifts as they happen, improving response agility.
- Channel Optimization: Identifies which sales channels and retailers deliver the best ROI.
- Enhanced Forecasting: Improves market demand prediction using trend and growth data.
- Performance Benchmarking: Allows detailed competitor analysis using share, growth, and pricing insights.
- Brand Portfolio Management: Enables efficient allocation of marketing budgets across brands based on their contribution.
KPIs to Track in Company Market Share Analysis Dashboard
Tracking these KPIs helps businesses monitor competitiveness, channel performance, and growth over time:
- Total Market Sales: Overall retail sales across the industry.
- Company Sales: Total company contribution to market sales.
- Overall Market Share (%): Company’s total market value percentage share.
- Same-Store Market Share (%): Consistent performance comparison for long-standing stores.
- Channel Market Share (%): Share of sales through specific retail or distribution channels.
- Top Channel Contribution (%): Percentage of total sales coming from the leading sales channel.
- YoY Growth (%): Year-over-year company growth rate.
- Top Competitor Share (%): Share percentage held by leading competitors.
These KPIs make the company's market share and competitor analysis dashboard a critical tool for performance evaluation and alignment of competitive strategies.
Frequently Asked Questions
Q1. What is the main purpose of a Company Market Share Analysis Dashboard?
It helps organizations understand their position in the market by comparing internal performance with industry totals and competitor standings.
Q2. Who can use this dashboard?
It’s suitable for business leaders, category managers, analysts, and sales strategists managing multi-channel retail operations.
Q3. How does it support decision-making?
Visualizing key indicators like growth, share, and channel contribution helps prioritize investments and optimize resource allocation.
Q4. Can it track competitor growth trends?
Yes, the company market share analysis dashboard tracks competitors through comparative KPIs and growth benchmarks.