What is a Community Pediatrics Analytics Dashboard?
A Community Pediatrics Analytics Dashboard template is developed for hospitals and institutions to monitor, assess, and improve child health at the community and population levels. The dashboard wireframe includes diverse components like preventive care metrics, screening, immunization statistics, and growth tracking to help pediatric specialists, program managers, and healthcare executives streamline early detection, intervention, and overall pediatric health quality.
How to Create a Community Pediatrics Analytics Dashboard
You don’t need to build your report from scratch—just start with a ready-to-use Community Pediatrics Analytics dashboard template from Mokkup. Add in your data and export it however you like. Here’s how to do it:
1. Create or Log in to Your Mokkup Account
Start by signing up on Mokkup.ai using your email. If you already have an account, just log in, and you’ll be good to go.
2. Choose and Customize Your Dashboard Template
Find the Community Pediatrics Analytics Dashboard template in the Templates section. Use the drag-and-drop editor to adjust KPIs, edit filters, or add elements based on your data.
3. Export to Your BI Tool
Once your dashboard wireframe is ready, use the BI Tool Export feature to send it directly to Power BI or Tableau for further analysis and enhancements. You can also download the dashboard as a PDF, PNG, or JPEG, embed it on a platform, or invite your team to collaborate.
Note: This is a Pro template. You’ll need a Pro subscription on Mokkup to use and customize this dashboard wireframe. Upgrade anytime to unlock full access.
Community Pediatrics Analytics Dashboard Example
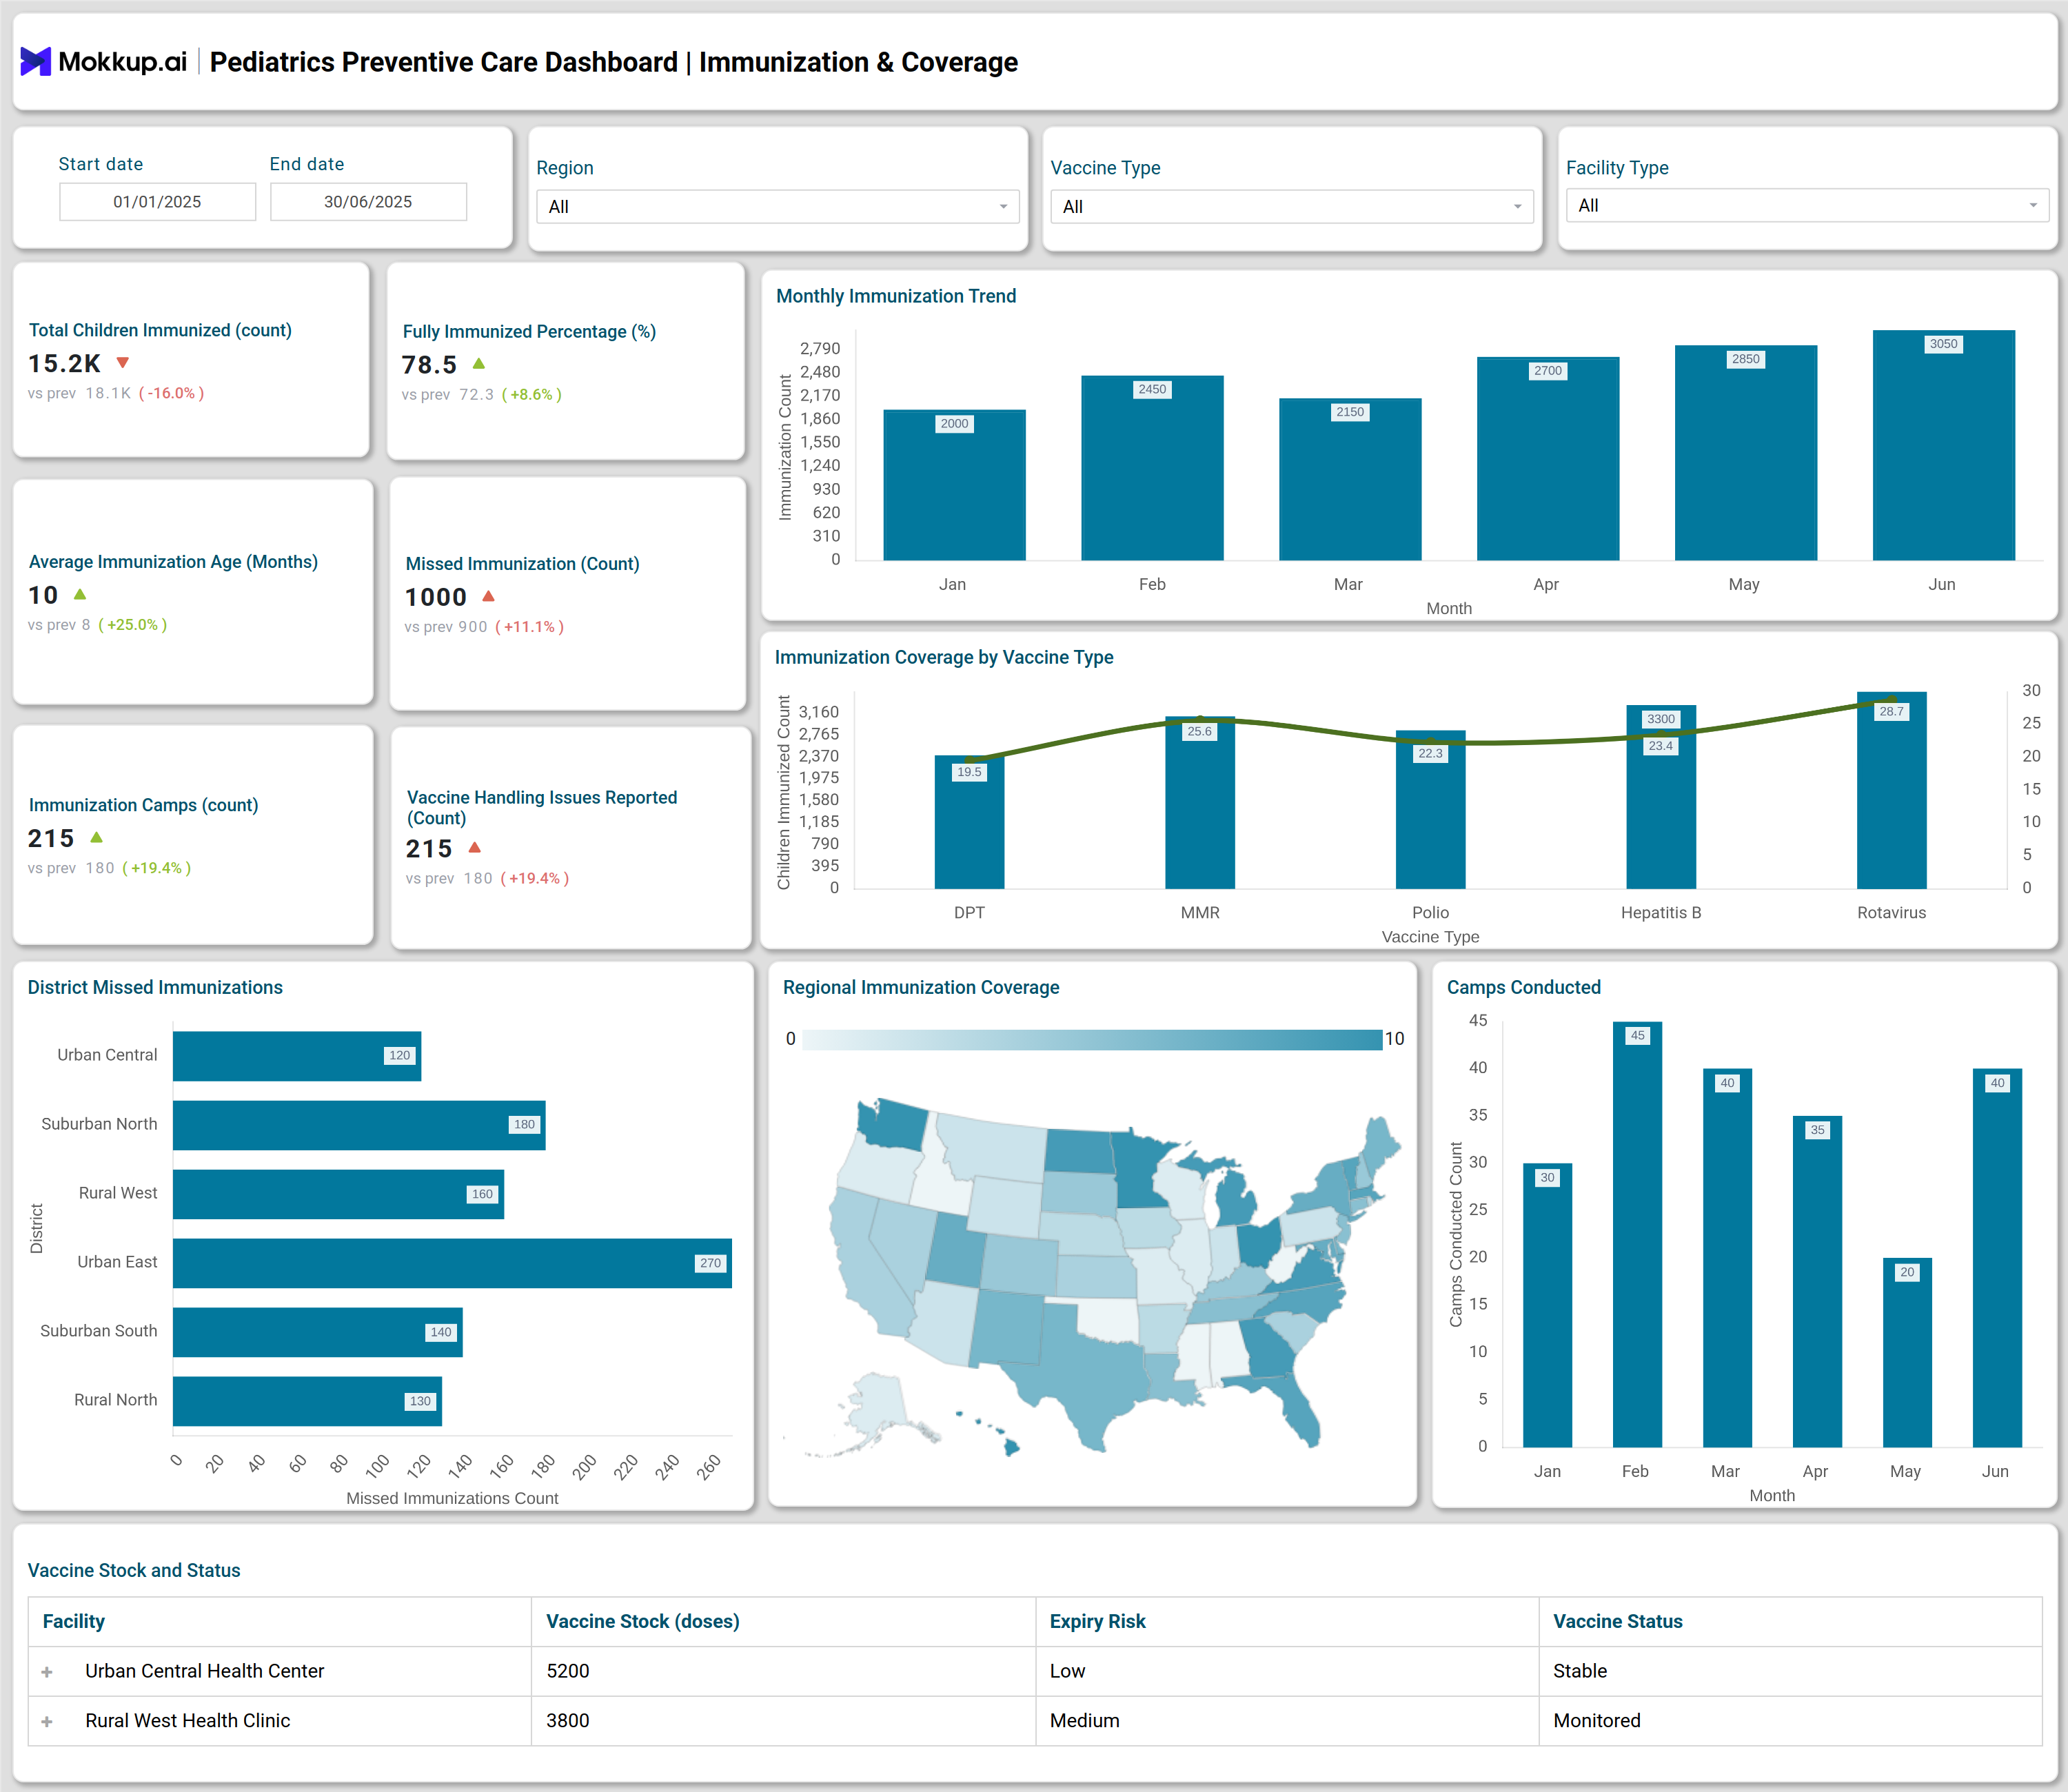
A typical Community Pediatrics Analytics Dashboard provides user-friendly access to screening and immunization data over custom date ranges and geographical locations. For example, the dashboard allows tracking of the total number of children screened, abnormal screening findings, cases referred for further evaluation, and follow-up completions. It features modules for analyzing monthly screenings, screening abnormal distributions (such as vision, dental, growth, developmental, and hemoglobin), doctor performance metrics, regional coverage, and immunization trends segmented by vaccine type. The dashboard template provides visual insights into screening progression funnels, camp-specific screening details, as well as vaccine stock and cold chain status.
How to Analyze Data in Community Pediatrics Analytics Dashboards
The dashboard template helps gain actionable insights into pediatric screenings, immunizations, and overall community child health:
- Track Screening & Follow-Up: Monitor community-wide screening totals and follow-up completion rates.
- Filter by Demographics: Analyze data by date, age group, location, and screening type for targeted insights.
- Evaluate Preventive Care Metrics: Examine abnormal findings, referrals, and average screening durations to assess program efficiency.
- Benchmark Immunization Coverage: Compare vaccination rates across regions and facilities for population health insights.
- Assess Growth & Development Trends: Review pediatric growth dashboards to identify patterns in abnormal findings.
- Monitor Doctor Performance: Evaluate contributions of individual doctors to screening programs.
- Manage Vaccine Logistics: Track cold chain status and vaccine stock to minimize gaps.
- Analyze Geographic Coverage: Identify disparities in pediatric health service availability.
Benefits of Community Pediatrics Analytics Dashboards
The dashboard template helps hospitals and program managers optimize pediatric preventive care and vaccination programs:
- Real-Time Child Health Monitoring: Track screenings and immunizations at institutional and regional levels.
- Early Detection & Intervention: Improve preventive care metrics through timely insights.
- Vaccination Coverage Tracking: Ensure full immunization status across populations.
- Efficient Resource Allocation: Visualize vaccine stock, cold chain risks, and service gaps.
- Data-Driven Decision Making: Support evidence-based planning for community health programs.
- Enhanced Transparency & Reporting: Simplify reporting for pediatric program managers.
KPIs to Track in Community Pediatrics Analytics Dashboards
Monitor these key metrics to evaluate pediatric preventive care, screening effectiveness, and immunization coverage:
- Total Children Screened: Shows the scale of community health outreach.
- Abnormal Screening Findings: Highlights children with potential health issues.
- Referred Cases: Tracks the volume of children sent for further evaluation.
- Follow-Up Completions: Measures the effectiveness of ongoing care.
- Monthly Screening Count: Provides trends in preventive engagement.
- Pediatric Vaccination Tracking: Captures the rate of immunization coverage.
Frequently Asked Questions
Q1.Who benefits from a community pediatrics analytics dashboard?
Hospitals, institutions, program managers, and pediatric specialists use these dashboards to improve child health operationally and strategically.
Q2.What features improve immunization tracking?
Modules for vaccine stock, distribution coverage, missed immunizations, and vaccine handling facilitate comprehensive influenza, hepatitis, and MMR immunization management.
Q3.Can the dashboard be customized for various locations or camps?
Yes, users can filter data by location, camp type, age group, and screening or vaccine types to extract specific insights.