What is a Child Health Program Dashboard?
A Child Health Program Dashboard is a specialized analytics tool designed for pediatric hospitals and healthcare institutions to monitor, visualize, and report key metrics related to children's health and well-being. It provides administrators, clinicians, and program managers with real-time insights into child healthcare monitoring, population screening, and pediatric health program effectiveness.
How to Create a Child Health Program Dashboard
You don’t need to build your report from scratch—just start with a ready-to-use dashboard template from Mokkup. Add in your data and export it however you like. Here’s how to do it:
1. Create or Log in to Your Mokkup Account
Start by signing up on Mokkup.ai using your email. If you already have an account, just log in, and you’ll be good to go.
2. Choose and Customize Your Dashboard Template
Find the Child Health Program Dashboard template in the Templates section. Use the drag-and-drop editor to adjust KPIs, edit filters, or add elements based on your data.
3. Export to Your BI Tool
Once your dashboard wireframe is ready, use the BI Tool Export feature to send it directly to Power BI or Tableau for further analysis and enhancements. You can also download the dashboard as a PDF, PNG, or JPEG, embed it on a platform, or invite your team to collaborate.
Note: This is a Pro template. You’ll need a Pro subscription on Mokkup to use and customize this dashboard wireframe. Upgrade anytime to unlock full access.
Child Health Program Dashboard Example
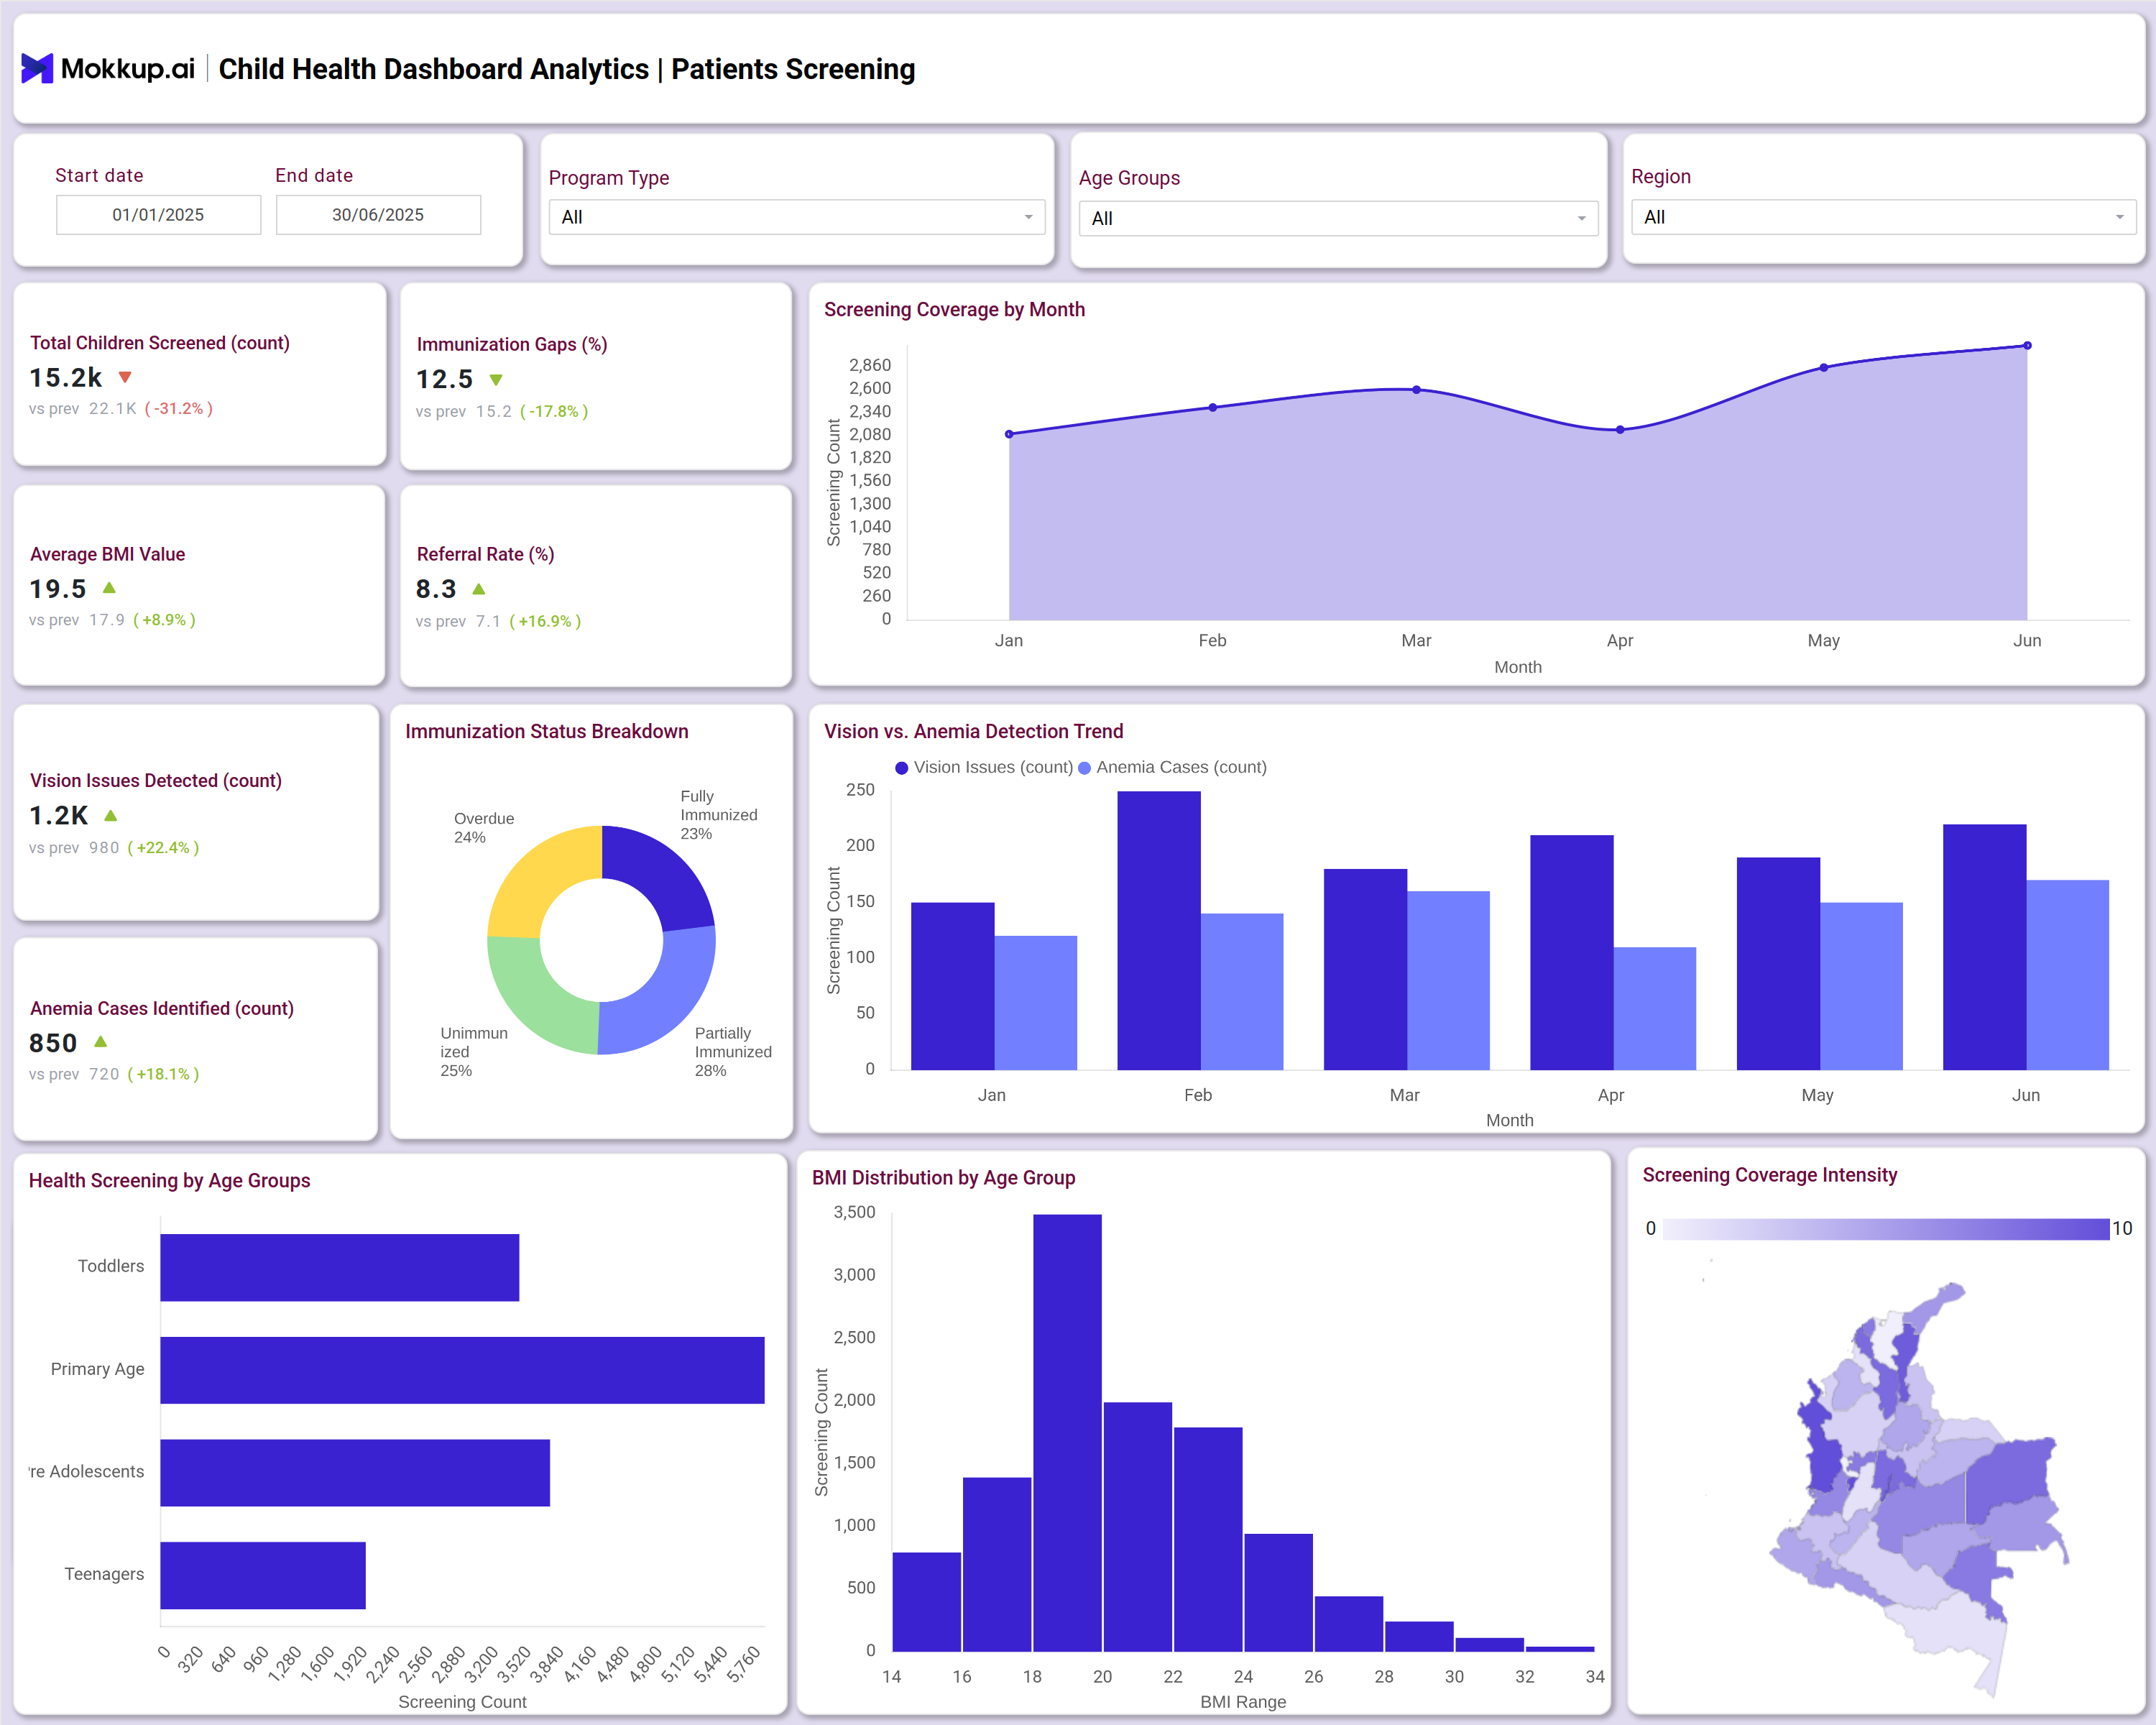
This dashboard template integrates features such as screening volumes, immunization gaps, average BMI values, referral rates, detection rates for vision issues and anemia, and distributions by age group or region. Users can filter by program type, age group, and district to drill down into detailed child health metrics. The dashboard offers interactive graphs and visual summaries, including monthly trends, immunization status breakdowns, and comparisons across districts. These components make it an essential solution for hospitals and government institutions focused on pediatric program analytics and child wellness dashboard operations.
How to Analyze Data in Child Health Dashboards
To get the most out of these dashboards, here’s how you can break down and interpret the data effectively:
- Use filters to view metrics by age group, district, or program type for targeted insights.
- Review month-on-month screening coverage to identify seasonal trends or gaps.
- Analyze immunization status and gaps to monitor vaccination program success.
- Compare cases of anemia and vision issues to spot correlations in health outcomes.
- Examine BMI and age group distributions for nutritional surveillance.
- Track screening intensity across regions with coverage maps for operational planning.
These capabilities are essential when evaluating insights from the best child health program dashboard.
Benefits of Child Health Dashboards
Child health dashboards — including any well-designed pediatric health dashboard — offer several operational and clinical advantages:
- Centralized pediatric insights: Centralizes pediatric health analytics for hospital operations and program management.
- Faster trend detection: Enables rapid identification of health trends and gaps in population coverage.
- Better care outcomes: Improves quality of care through targeted tracking of immunization, nutrition, and screening activities.
- Data-led decision support: Facilitates data-driven decision-making for child healthcare monitoring and intervention strategies.
- Simplified reporting: Streamlines reporting for institutional and public health requirements.
KPIs to Track in Child Health Dashboards
- Total Children Screened: Monitors the overall reach of health programs through screening volume.
- Immunization Gaps: Measures coverage shortfalls within vaccination initiatives.
- Average BMI Value: Assesses nutrition and growth trends across pediatric populations.
- Referral Rate: Tracks clinical follow-up needs for screened children.
- Vision Issues Detected: Records the frequency of vision problems identified during screenings.
- Anemia Cases Identified: Monitors the incidence of anemia in child populations.
Frequently Asked Questions
1. What kind of organizations use child health dashboards?
Pediatric hospitals, community health programs, public health agencies, and school-based health initiatives use these dashboards to improve operational oversight and care quality.
2. How do child health metrics dashboards improve healthcare delivery?
They provide actionable insights on immunization, nutrition, screening, and referral data, enabling more effective resource allocation and program management.
3. What KPIs does a pediatric health dashboard typically track?
It usually monitors metrics like total children screened, immunization coverage, BMI trends, anemia and vision issue detection rates, referral volumes, and regional screening intensity. These KPIs help evaluate program reach, early diagnosis, and overall child wellness outcomes.