
What is a Coal Power Generation IT Dashboard?
A Coal Power Generation IT dashboard template provides utility operators with a single system to monitor the health and performance of IT assets that support coal-based power plants. These assets include applications, networks, servers, security tools, backup systems, and user support functions. Power stations depend on stable IT infrastructure to ensure a continuous electricity supply, safe plant operations, and secure digital environments.
When IT systems fail, plant output, worker coordination, and safety controls can be affected. This dashboard consolidates KPIs, alerts, and performance trends into a single interface. IT teams use it to track outages, slow systems, security events, and hardware stress before they impact plant performance. A coal power generation dashboard for IT operations helps decision-makers identify issues early, plan maintenance, and maintain stable critical workloads.
Utilities also utilize this dashboard to track the success of change management, service quality, incident response times, and cybersecurity monitoring for power generation IT teams. With structured IT performance monitoring in coal power plants, reliability improves, and operational risk is reduced.
How to Create a Coal Power Generation IT Dashboard
You don’t need to build your report from scratch—just start with a ready-to-use Coal Power Generation IT dashboard template from Mokkup. Add in your data and export it however you like. Here’s how to do it:
1. Create or Log in to Your Mokkup Account
Start by signing up on Mokkup.ai using your email. If you already have an account, just log in, and you’ll be good to go.
2. Choose and Customize Your Dashboard Template
Find the Coal Power Generation IT Dashboard template in the Templates section. Use the drag-and-drop editor to adjust KPIs, edit filters, or add elements based on your data.
3. Export to Your BI Tool
Once your dashboard wireframe is ready, use the BI Tool Export feature to send it directly to Power BI or Tableau for further analysis and enhancements. You can also download the dashboard as a PDF, PNG, or JPEG, embed it on a platform, or invite your team to collaborate.
Note: This is a Pro template. You’ll need a Pro subscription on Mokkup to use and customize this dashboard wireframe. Upgrade anytime to unlock full access.
Coal Power Generation IT Dashboard Example
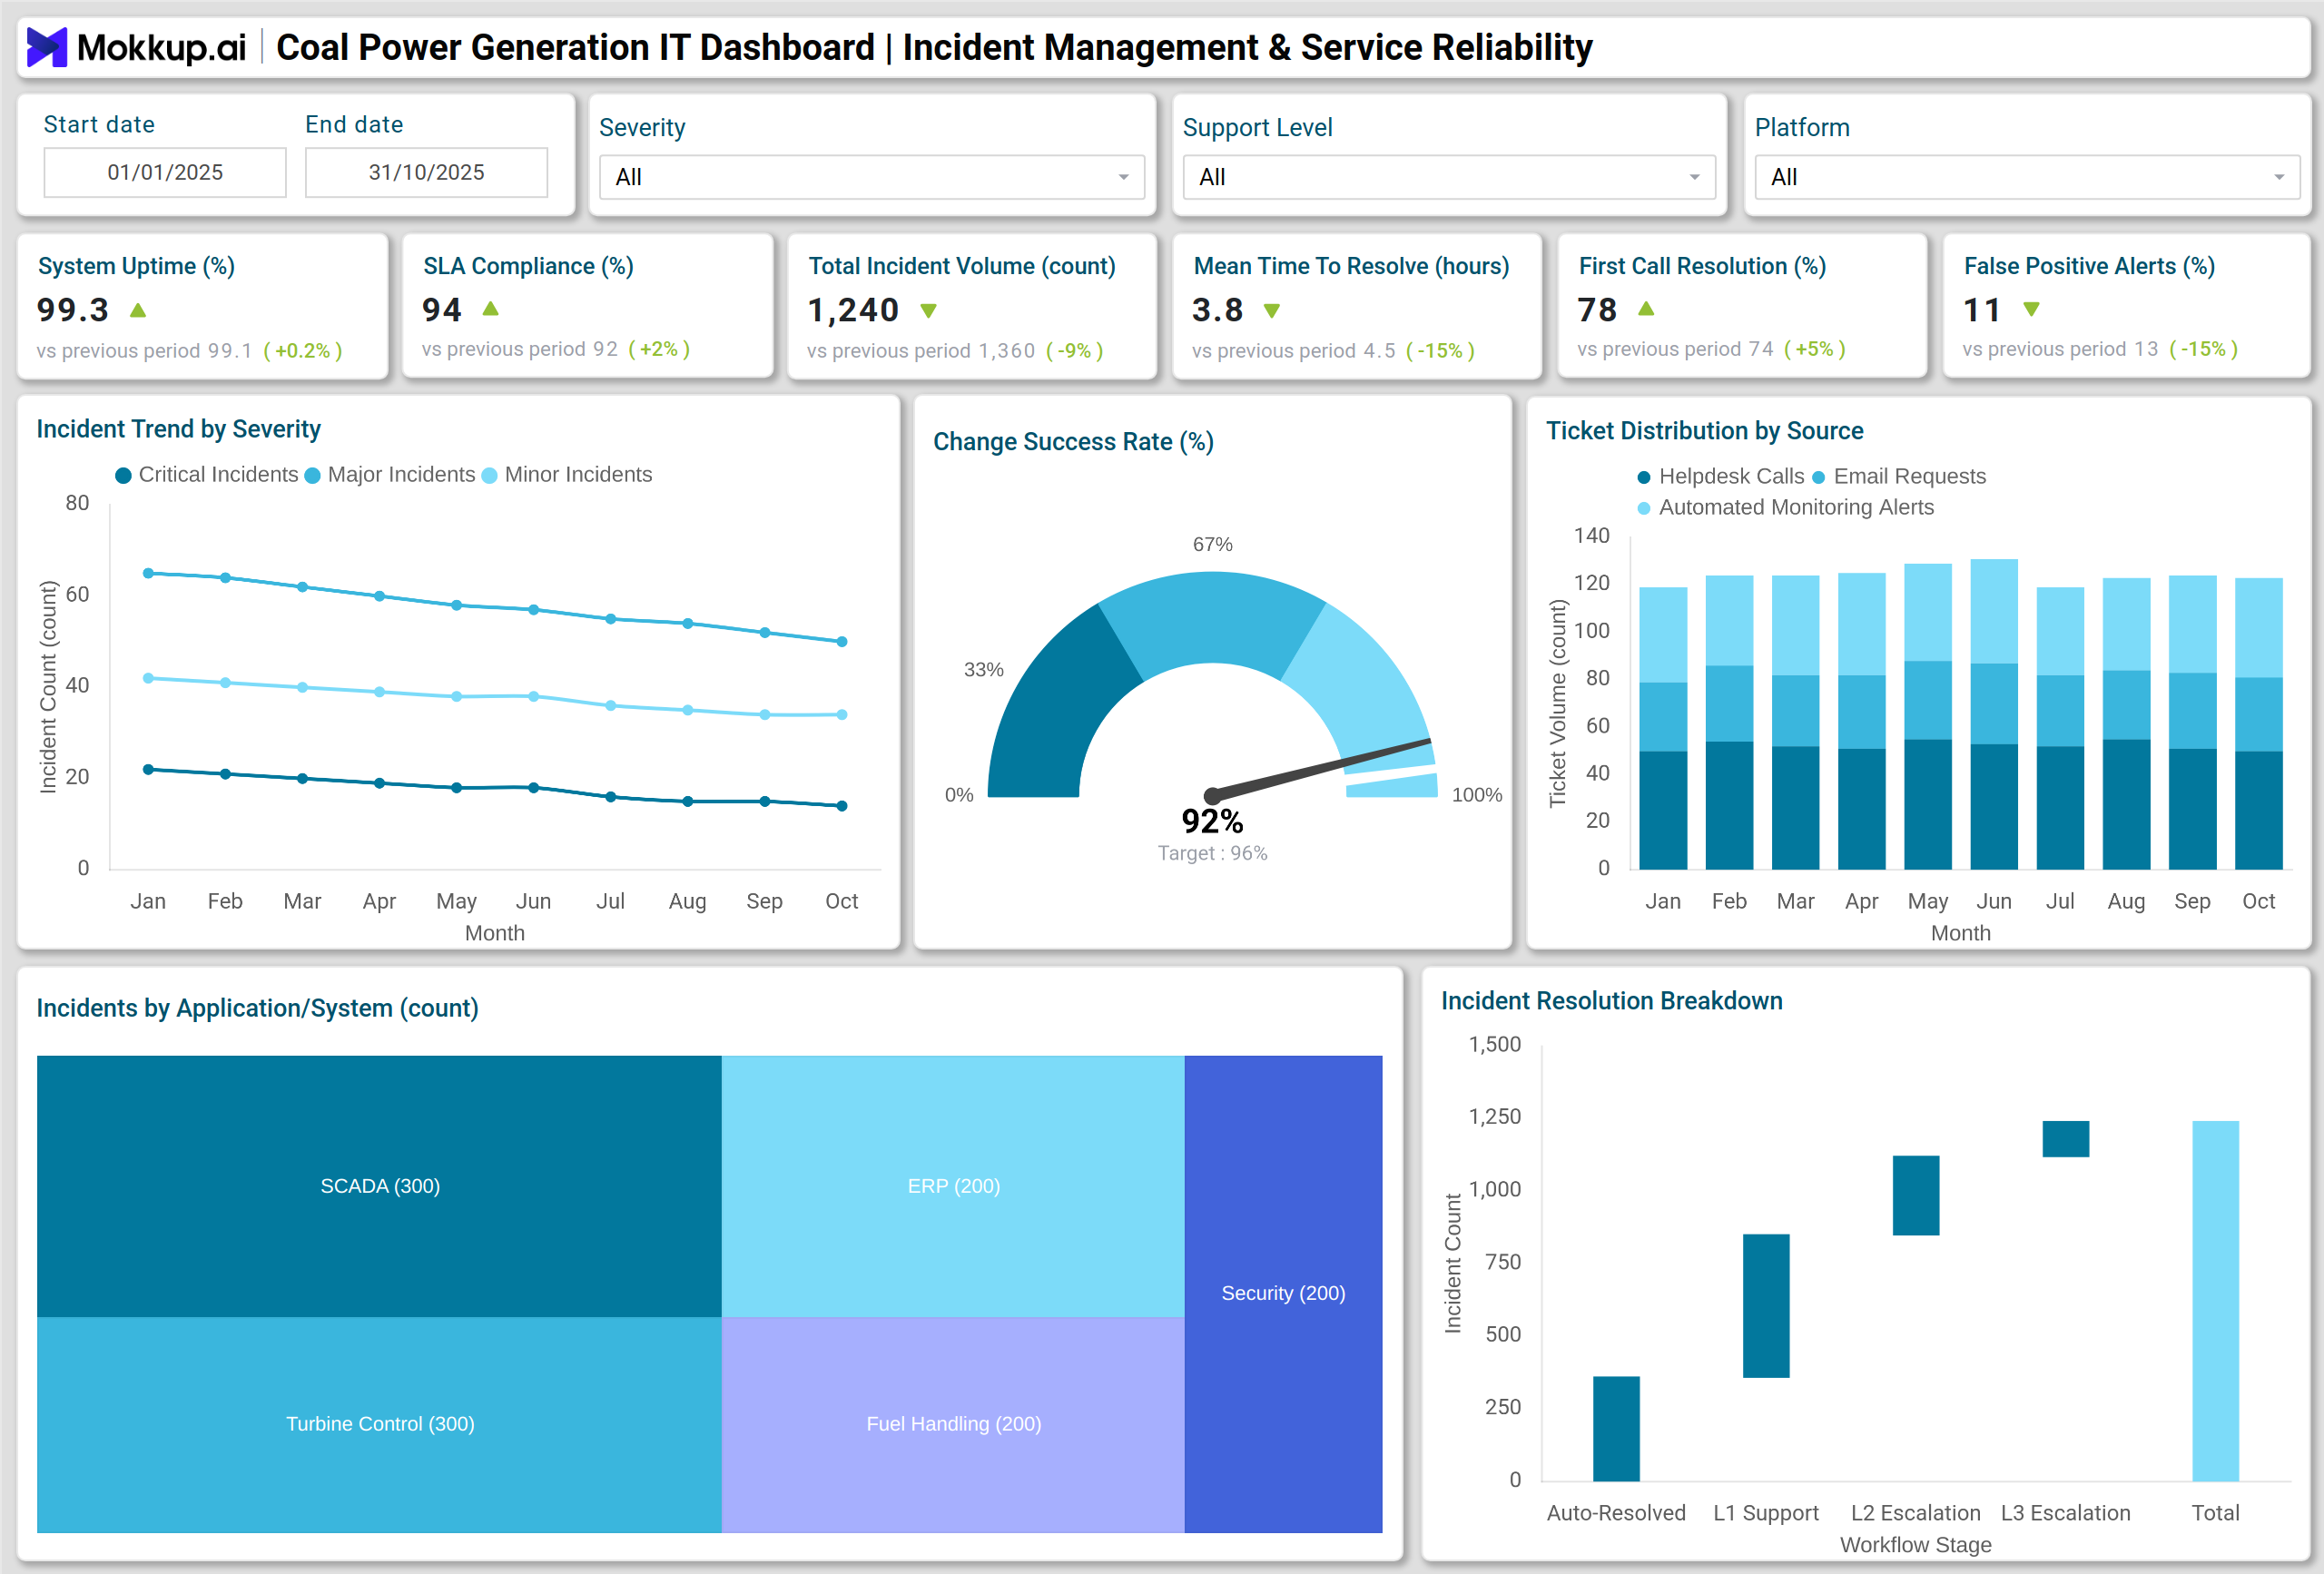
A typical Coal Power Generation IT Dashboard shows service health, tickets, incidents, network stability, and system uptime. The starting view often displays the SLA Compliance Rate to verify whether service commitments are being met. System or service uptime highlights continuity of IT workloads that support turbine control, coal handling, safety systems, and internal communication.
Incident Volume, System Resource Utilization, Capacity Utilization, and Network Latency help teams identify overload conditions that can slow mission-critical applications. Telemetry Lag shows delays in system readings across plants and facilities, which is important for monitoring sensors, control panels, and connected equipment. A high backup success rate prevents data loss during emergencies. The False Positive Alert Rate indicates the efficiency of monitoring tools and cybersecurity modules.
Visualizations help operators interpret patterns quickly. Line charts track severity-based incident spikes, while a pie chart highlights the most common incident categories, such as network, application, hardware, or security. A stacked bar chart illustrates the reasons for SLA violations, and a donut chart displays the status of backup jobs as successful, failed, partial, or skipped. A waterfall chart breaks down incident resolution phases, allowing managers to identify where delays occur. This setup supports application performance tracking in coal-based power utilities, making troubleshooting structured and measurable.
A Coal Power Generation IT Dashboard supports IT performance monitoring in coal power plants by helping teams track outages, cybersecurity risks, and system health. With KPI tracking for coal power plant IT systems, utilities improve stability and support application performance tracking in coal-based power utilities
How to Analyze Data in Coal Power Generation IT Dashboards
A Coal Power Generation IT Dashboard provides visibility into the performance, reliability, and efficiency of IT infrastructure supporting plant operations. It helps identify system bottlenecks, monitor uptime, and ensure that digital assets are aligned with operational goals:
- Study Incident Spikes: Identify which systems or applications experience the most frequent failures to prioritize maintenance and preventive measures.
- Compare Uptime with Maintenance Windows: Analyze uptime trends alongside scheduled maintenance to plan downtime strategically and reduce disruptions.
- Track Mean Time to Repair (MTTR): Evaluate how quickly issues are diagnosed and resolved to improve IT response efficiency.
- View Capacity Utilization: Monitor utilization by asset type to prevent system overloads and optimize performance.
- Monitor Backup Success Trends: Track backup success rates to minimize data recovery risks and ensure business continuity.
- Analyze Incident Distribution: Use charts to pinpoint common failure types and allocate resources more effectively.
- Review Telemetry Lag Heatmaps: Detect sites experiencing delayed sensor or control updates to maintain real-time accuracy.
- Check Change Success Rates: Evaluate deployment quality by analyzing the percentage of successful IT changes.
- Compare Resource Utilization with Ticket Volume: Assess the workload impact on IT staff and identify areas that need automation or process improvement.
- Use SLA Breach Analysis: Review breach reasons to prioritize vendor or engineering fixes and strengthen service reliability.
Benefits of Coal Power Generation IT Dashboards
Implementing an IT dashboard in coal power generation operations enhances visibility, minimizes downtime, and strengthens data-driven decision-making across systems and services:
- Improved KPI Tracking: Provides real-time tracking of IT system performance across the power plant.
- Early Outage Detection: Identifies potential failures before they lead to downtime.
- Optimized Maintenance Planning: Helps schedule server, network, and application maintenance efficiently.
- Strengthened Cybersecurity: Supports ongoing monitoring for security vulnerabilities in critical systems.
- Enhanced Service Predictability: Ensures reliable service delivery for plant operations and support teams.
- Root-Cause Visibility: Reduces recurring incidents by identifying underlying technical issues.
- Backup Oversight: Protects critical configuration and data records through consistent backup tracking.
- Smarter Help Desk Operations: Enhances decision-making by utilizing metrics such as first-call resolution and ticket trends.
- Compliance Readiness: Simplifies audit reporting through accurate IT performance histories.
- Data-Backed Upgrades: Enables leaders to justify infrastructure improvements with measurable results.
KPIs to Track in Coal Power Generation IT Dashboards
Tracking key performance indicators (KPIs) in an IT dashboard helps measure service reliability, response speed, and overall infrastructure health within coal power generation operations:
- SLA Compliance Rate: Measures the frequency at which IT services meet agreed-upon service levels.
- Incident Volume: Counts total reported incidents across systems and services.
- System or Service Uptime: Shows the percentage of time systems remain operational.
- Mean Time To Repair: Tracks the average time required to restore a service after failure.
- First Call Resolution Rate: Indicates the percentage of tickets that are resolved without escalation.
- Repeat Incident Rate: Measures the frequency at which the same issue reappears after closure.
- Network Latency: Shows delay in network response between systems and locations.
Frequently Asked Questions
Q1. Who uses a Coal Power Generation IT Dashboard?
IT managers, cybersecurity teams, plant reliability engineers, and support teams inside electric power utilities use this dashboard to manage performance and stability across IT systems.
Q2. How does this dashboard help reduce outages?
It tracks uptime, capacity utilization, incident levels, and network delays. When indicators show abnormal behavior, operators can fix issues before they interrupt plant operations.
Q3. Which systems can be monitored?
Applications, servers, networks, cybersecurity tools, storage systems, plant control modules, and ticketing platforms in coal power generation environments can be monitored.
Q4. Why is backup success important in coal-based utilities?
Coal plants rely on configuration files, system logs, and operational data to function effectively. Backup monitoring safeguards against data loss resulting from hardware failures, cyber threats, or routine maintenance activities.
Q5. Can this dashboard support cybersecurity monitoring?
Yes. False positive alerts, suspicious activity indicators, and incident root-cause tracking help cybersecurity monitoring for IT teams in power generation.
Q6. How does a utility benefit from KPI tracking?
Utilities gain proof of system performance, improved response processes, better maintenance scheduling, and clear visibility into capacity limits or bottlenecks.