A company makes huge efforts to acquire customers, yet the hard part is to retain customers & enhance their satisfaction level. Suppose marketers can know the customer segment that is more likely to purchase & their spending power. In that case, they can align their strategy to focus on the best experience for this customer segment. Fortunately, we have a method that answers the above situation.
The dashboard wireframe comprises three screens: Customer Segmentation, Categorial Customer Segmentation, & Geographical Customer Segmentation; each of them is explained briefly below.
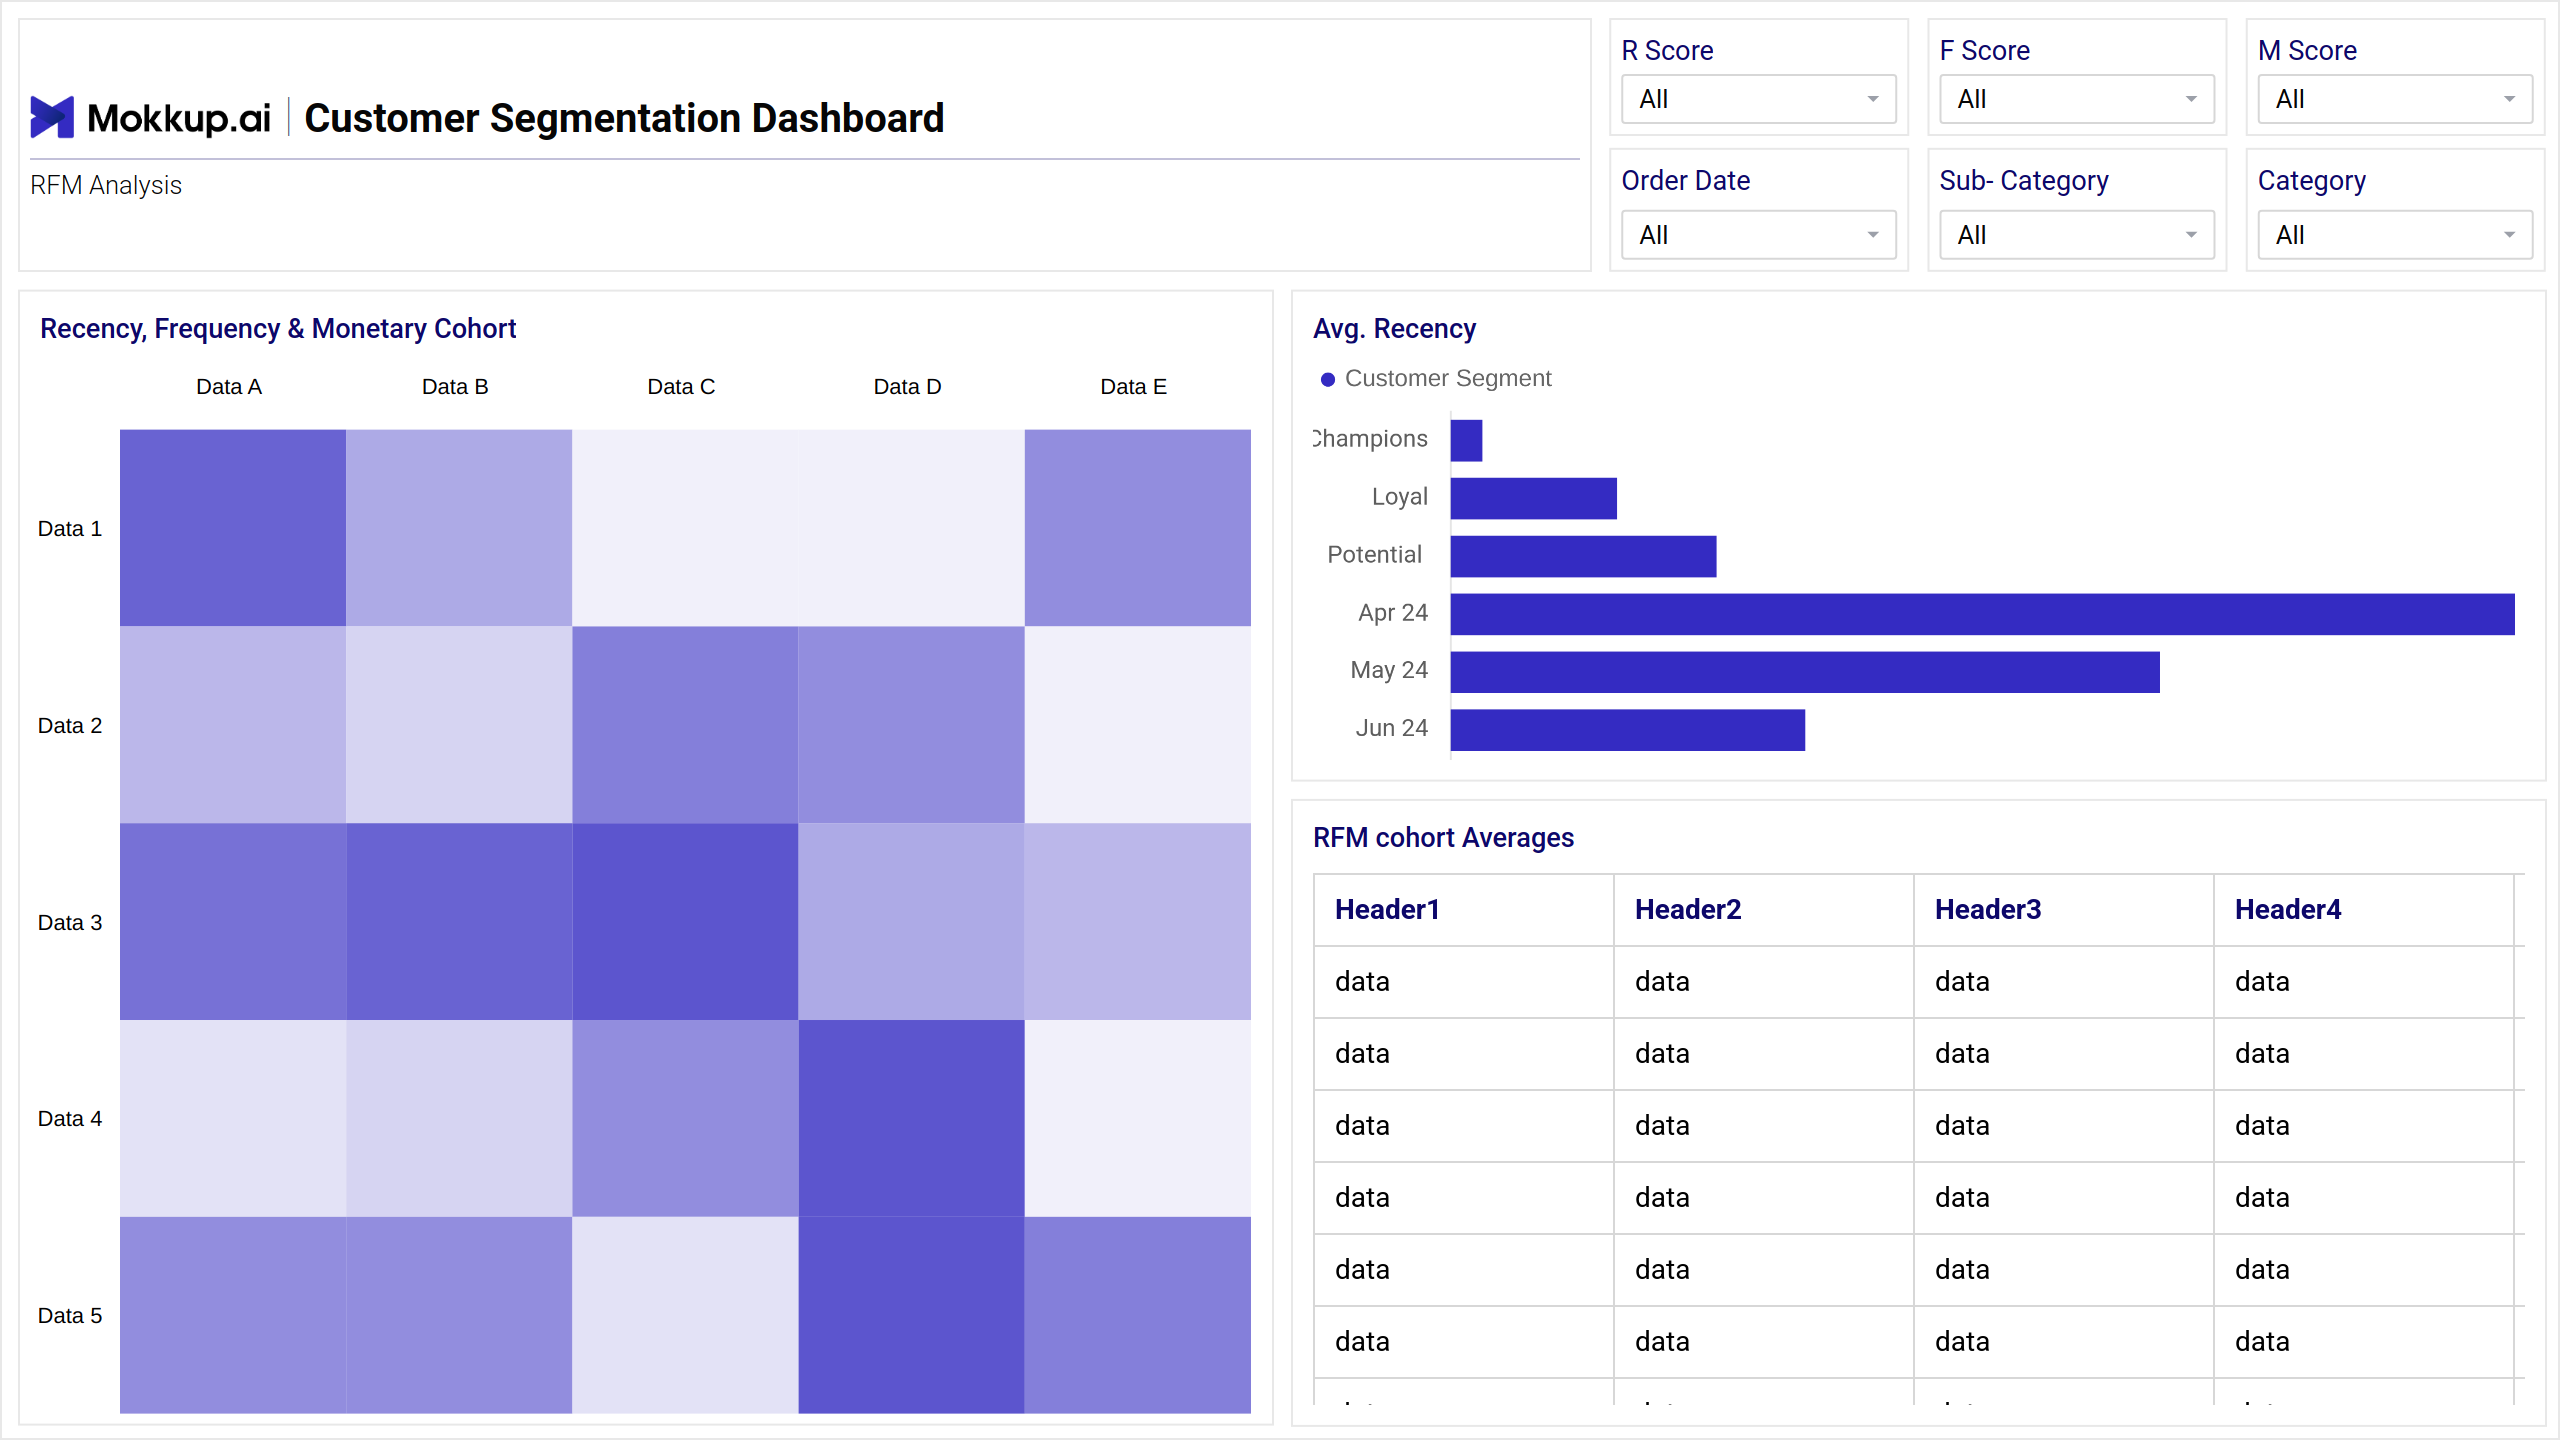
Customer Segmentation Dashboard
This screen outlines a dashboard design to unlock the power of your customer base. By segmenting customers based on key characteristics like behavior, value, and demographics, you'll gain insightful snapshots of each group, their needs, and their impact.
Key Terms to Know
- Recency: How recently the user visited the website/app & made a purchase
- Frequency: How frequently the customer interacts & frequency of purchases made per visit
- Monetary: Money spent per purchase might include customer lifetime value
- Avg. Recency: Reveals how engaged your SaaS customers are by showing the average time since their last interaction
- RFM Cohort Averages: Benchmarks customer segments based on Recency, Frequency, & Monetary value over time, revealing acquisition & retention trends.
Categorial Customer Segmentation
This screen organizes and analyzes your audience using preset categories such as demographics, firmographics, or behavior patterns. Easily track metrics, compare segments, and identify trends to inform targeted marketing and business growth.
Key Terms to Know
- Cohort: Track customer journeys across defined groups (newcomers, loyalists, etc.) to understand acquisition, engagement, and churn patterns.
- RFM Scatterplot: Visualize Recency, Frequency, and Monetary value for each category, identifying high-value segments and potential churn risks.
- Categorial Purchases: Analyze what each category buys most often, revealing unique preferences and informing targeted product promotions.
Geographical Customer Segmentation
This screen delves into your customers' unique characteristics and behaviors across different regions. Visualize purchase patterns, sentiment analysis, and engagement metrics on a map, uncovering hidden trends and opportunities.
Key Terms to Know
-
Polymap: The poly map displays the geographic customer segmentation of the United States, with each segment being colored differently. The map also shows the RFM scores for each segment, which are a measure of how recent, frequent, and monetary a customer's purchases are.
Dashboard Template Insights
This dashboard wireframe is a good way to classify consumer classes for special care. Here are some key achievements:
- Identify high-value segments for personalized marketing and engagement, boosting conversions and revenue.
- Understand segment needs and preferences, driving more relevant features and updates that resonate.
- Tailor support experiences to different segments, improving satisfaction and efficiency.
Conclusion
RFM will enable the organizations to understand the customers based on their recency of purchase, money spent per basket & frequency of purchase. This will help decision-makers to categorize customers into different categories & thereby make investments in marketing accordingly. It will not only save costs but also maximize revenue, enhancing customer satisfaction levels at the same time.
Frequently Asked Questions
Q1. How to segment SaaS customers effectively?
SaaS customers can be segmented using RFM analysis (Recency, Frequency, Monetary), demographic data, behavior patterns, and purchase preferences to identify meaningful groups.
Q2. What metrics are important for customer segmentation analysis?
Key metrics include recency of interaction, purchase frequency, monetary value, cohort performance, and category-specific purchase trends.
Q3. Best practices for SaaS user behavior tracking?
Best practices include monitoring login frequency, feature usage, purchase history, churn patterns, and engagement levels across customer cohorts.
Q4. How to improve customer retention through segmentation?
Retention improves by identifying high-value segments, personalizing engagement, offering tailored support, and targeting at-risk groups with proactive campaigns.
Q5. What tools help analyze SaaS customer data?
Tools such as Tableau, Power BI, and CRM platforms with built-in analytics can help visualize and analyze SaaS customer data effectively.