
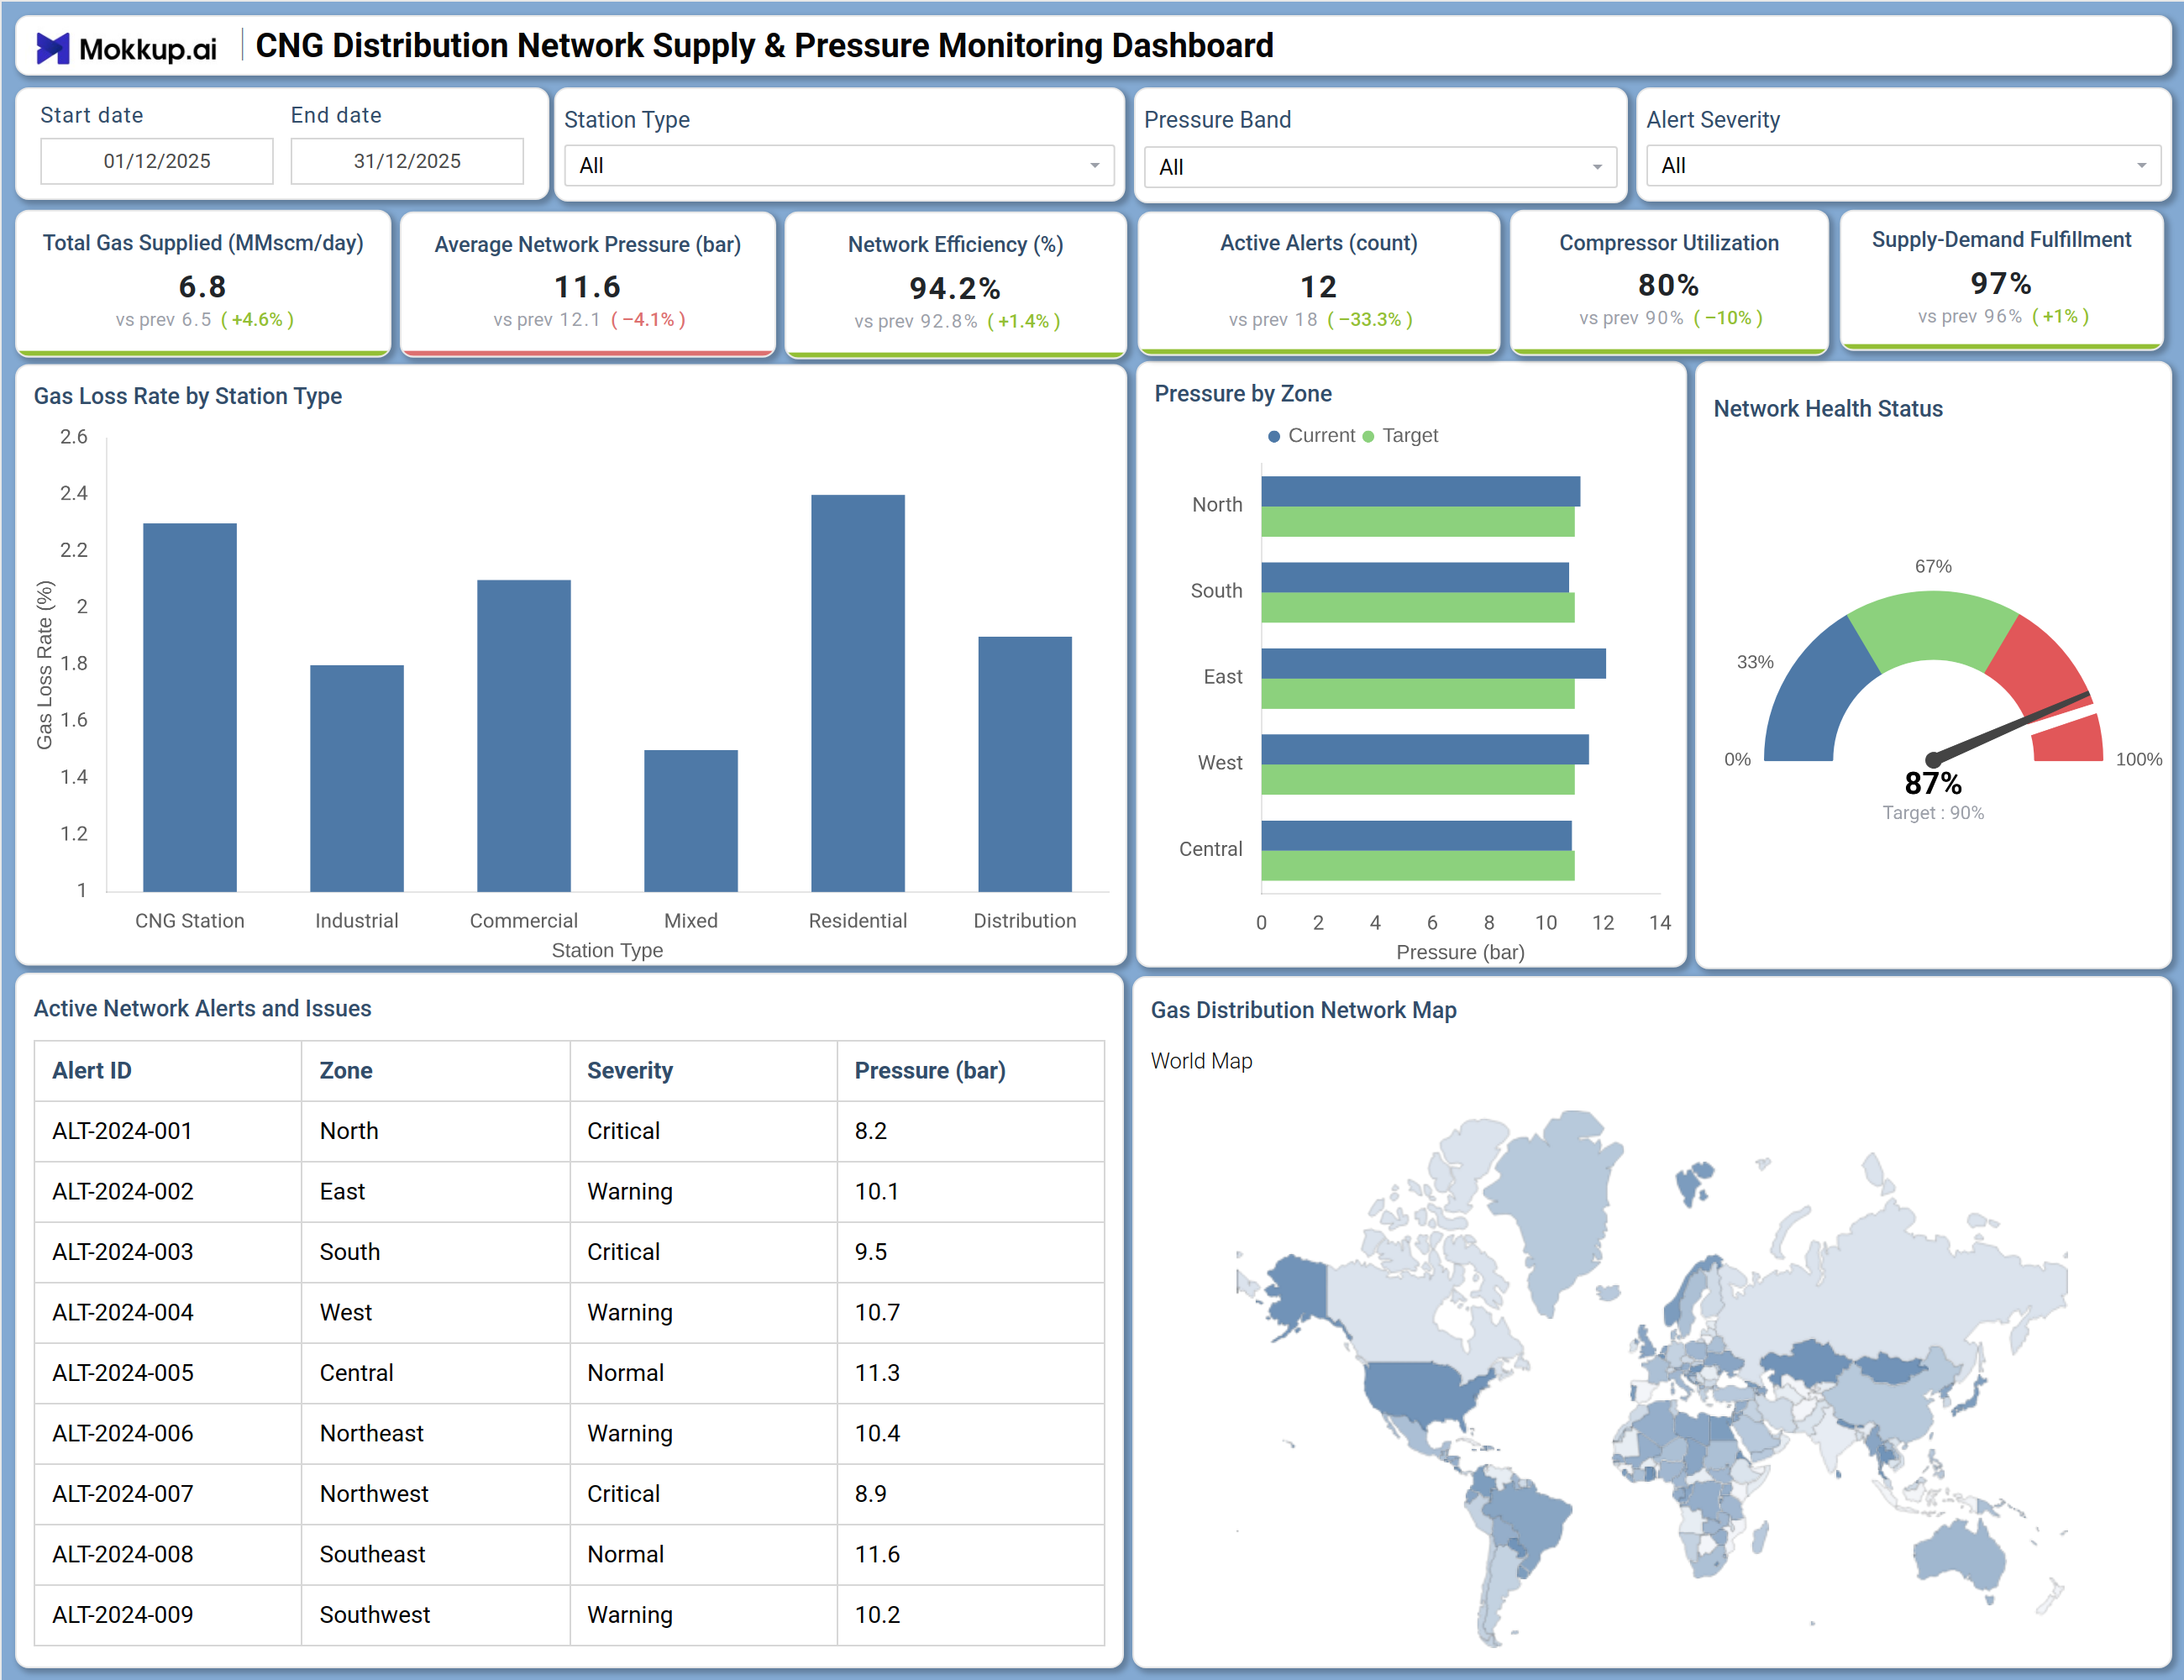
What is a CNG Distribution Network Supply & Pressure Monitoring Dashboard?
The CNG Distribution Network Supply & Pressure Monitoring Dashboard is a structured template designed for gas utility operators, network engineers, and distribution managers who need a consolidated view of CNG supply flow and pressure conditions across station types and geographic zones. It tracks total gas supplied, average network pressure, network efficiency, compressor utilization, active alerts, and supply-demand fulfillment in a single interface. Built for organizations running CNG distribution networks across industrial, residential, commercial, and mixed station types, this CNG distribution network pressure monitoring dashboard makes it faster to identify where gas loss, pressure deviations, or alert escalations are occurring before they affect service delivery. It supports date-range filtering, pressure band segmentation, and alert severity classification to help teams stay aligned with operational efficiency targets.
How to Create a CNG Distribution Network Supply & Pressure Monitoring Dashboard
1. Create or Log in to Your Mokkup Account
Start by signing up on Mokkup.ai using your email. If you already have an account, just log in, and you'll be good to go.
2. Choose and Customize Your Dashboard Template
Find the CNG Distribution Network Supply & Pressure Monitoring Dashboard template in the Templates section. Use the drag-and-drop editor to adjust KPIs, edit filters, or add elements based on your data.
3. Export to Your BI Tool
Once your dashboard wireframe is ready, use the BI Tool Export feature to send it directly to Power BI or Tableau for further analysis and enhancements. You can also download the dashboard as a PDF, PNG, or JPEG, embed it on a platform, or invite your team to collaborate.
Note: This is a Pro template. You'll need a Pro subscription on Mokkup to use and customize this dashboard wireframe. Upgrade anytime to unlock full access.
CNG Distribution Network Supply & Pressure Monitoring Dashboard Example
A network operations team opens this dashboard at the start of a shift to assess whether gas supply monitoring across the CNG distribution network is within expected thresholds. The KPI row at the top gives an immediate read on total gas supplied, average pressure, and supply-demand fulfillment, flagging whether the network is performing above or below the previous period. If a shortfall appears in supply-demand fulfillment, CNG network monitoring, the team narrows the view using the Station Type or Pressure Band filters to identify whether the gap is concentrated in residential, industrial, or distribution segments.
The Gas Loss Rate by Station Type bar chart helps distribution planners compare which station categories are contributing the most to network gas loss, making gas loss rate by station type analysis an accessible daily task rather than a manual exercise. The Active Network Alerts and Issues table gives operations staff a direct list of open alerts by zone and severity, so critical pressure deviations in specific zones can be escalated without having to query separate systems. The Pressure by Zone chart and Gas Distribution Network Map together help managers assess whether current pressure readings are tracking against targets across all regions.
How to Analyze Data in a CNG Distribution Network Supply & Pressure Monitoring Dashboard
Here is how you can analyze data from this dashboard:
- Apply the Station Type filter to isolate gas loss and pressure metrics for specific station categories such as CNG Station, Industrial, Commercial, or Residential.
- Review the Gas Loss Rate by Station Type bar chart to identify which station segments have the highest gas loss and need maintenance attention.
- Use the Pressure by Zone horizontal bar chart to compare current pressure readings against targets for each geographic zone including North, South, East, West, and Central.
- Filter by Pressure Band to focus analysis on zones operating outside acceptable pressure thresholds.
- Monitor the Network Health Status gauge to assess overall CNG network efficiency tracking dashboard progress toward the target score.
- Review the Active Network Alerts and Issues table filtered by Alert Severity to prioritize which critical or warning-level alerts require immediate response.
- Use the Date Range filter to compare supply and pressure performance across different operating periods.
- Track compressor utilization CNG distribution dashboard metrics against previous period benchmarks to detect underperformance trends.
Benefits of a CNG Distribution Network Supply & Pressure Monitoring Dashboard
The following are the benefits of using this dashboard:
- Centralizes supply volume, pressure, efficiency, and alert data for the entire CNG distribution network in one structured template.
- Supports gas supply monitoring CNG distribution network analysis across multiple station types simultaneously without rebuilding views.
- Reduces manual report assembly with pre-built KPI tiles for total gas supplied, compressor utilization, and supply-demand fulfillment.
- Enables zone-level pressure comparison against targets using the Pressure by Zone chart to guide infrastructure and maintenance decisions.
- Provides a severity-classified alert table so operations teams can prioritize responses across zones without toggling between tools.
- Helps distribution managers and network engineers align on performance across station types using a shared, filterable dashboard.
- Supports operational planning with the Gas Distribution Network Map for geographic visibility of pressure conditions across the network.
KPIs to Track in a CNG Distribution Network Supply & Pressure Monitoring Dashboard
The following key KPIs can be tracked by using this dashboard:
- Total Gas Supplied (MMscm/day): Measures the volume of compressed natural gas delivered across the network per day, the primary output indicator for CNG distribution network pressure monitoring dashboard reporting.
- Average Network Pressure (bar): Tracks mean pressure across all active zones, essential for detecting system-wide pressure deviations before they trigger service disruptions.
- Network Efficiency (%): Quantifies the ratio of effective gas delivery relative to total supply input, supporting CNG network efficiency tracking dashboard analysis and loss reduction planning.
- Active Alerts (count): Records the number of open network alerts flagged by zone and severity, used to gauge how many issues require active investigation or escalation.
- Compressor Utilization (%): Measures the proportion of compressor capacity currently in use. Compressor utilization CNG distribution dashboard data informs capacity planning and equipment scheduling.
- Supply-Demand Fulfillment (%): Tracks how effectively current gas supply is meeting network demand, a core metric for supply demand fulfillment CNG network monitoring and customer reliability management.
Frequently Asked Questions
1. What industries benefit most from the CNG Distribution Network Supply & Pressure Monitoring Dashboard?
This dashboard is built for CNG distribution operators, gas utility companies, and network infrastructure managers. It is most useful for teams managing multi-zone distribution networks across industrial, residential, and commercial station types.
2. Can this dashboard track zone-level pressure deviations against targets?
Yes. The Pressure by Zone horizontal bar chart displays current and target pressure values side by side for each zone, including North, South, East, West, and Central. Teams can quickly identify which zones are running below target and prioritize field response.
3. How does the Active Network Alerts and Issues table work?
The table lists each open alert with its Alert ID, zone location, severity classification (Critical, Warning, or Normal), and current pressure reading in bar. It gives operations teams a consolidated view of active issues without needing to query separate monitoring systems.