The Digital Content Engagement Dashboard template is designed to help organizations monitor content performance and audience behavior. The dashboard wireframe includes key metrics and visualizations to evaluate engagement, measure growth, and analyze the effectiveness of various content strategies. It allows businesses to optimize their digital activities for maximum reach and impact.
Key Terms to Know
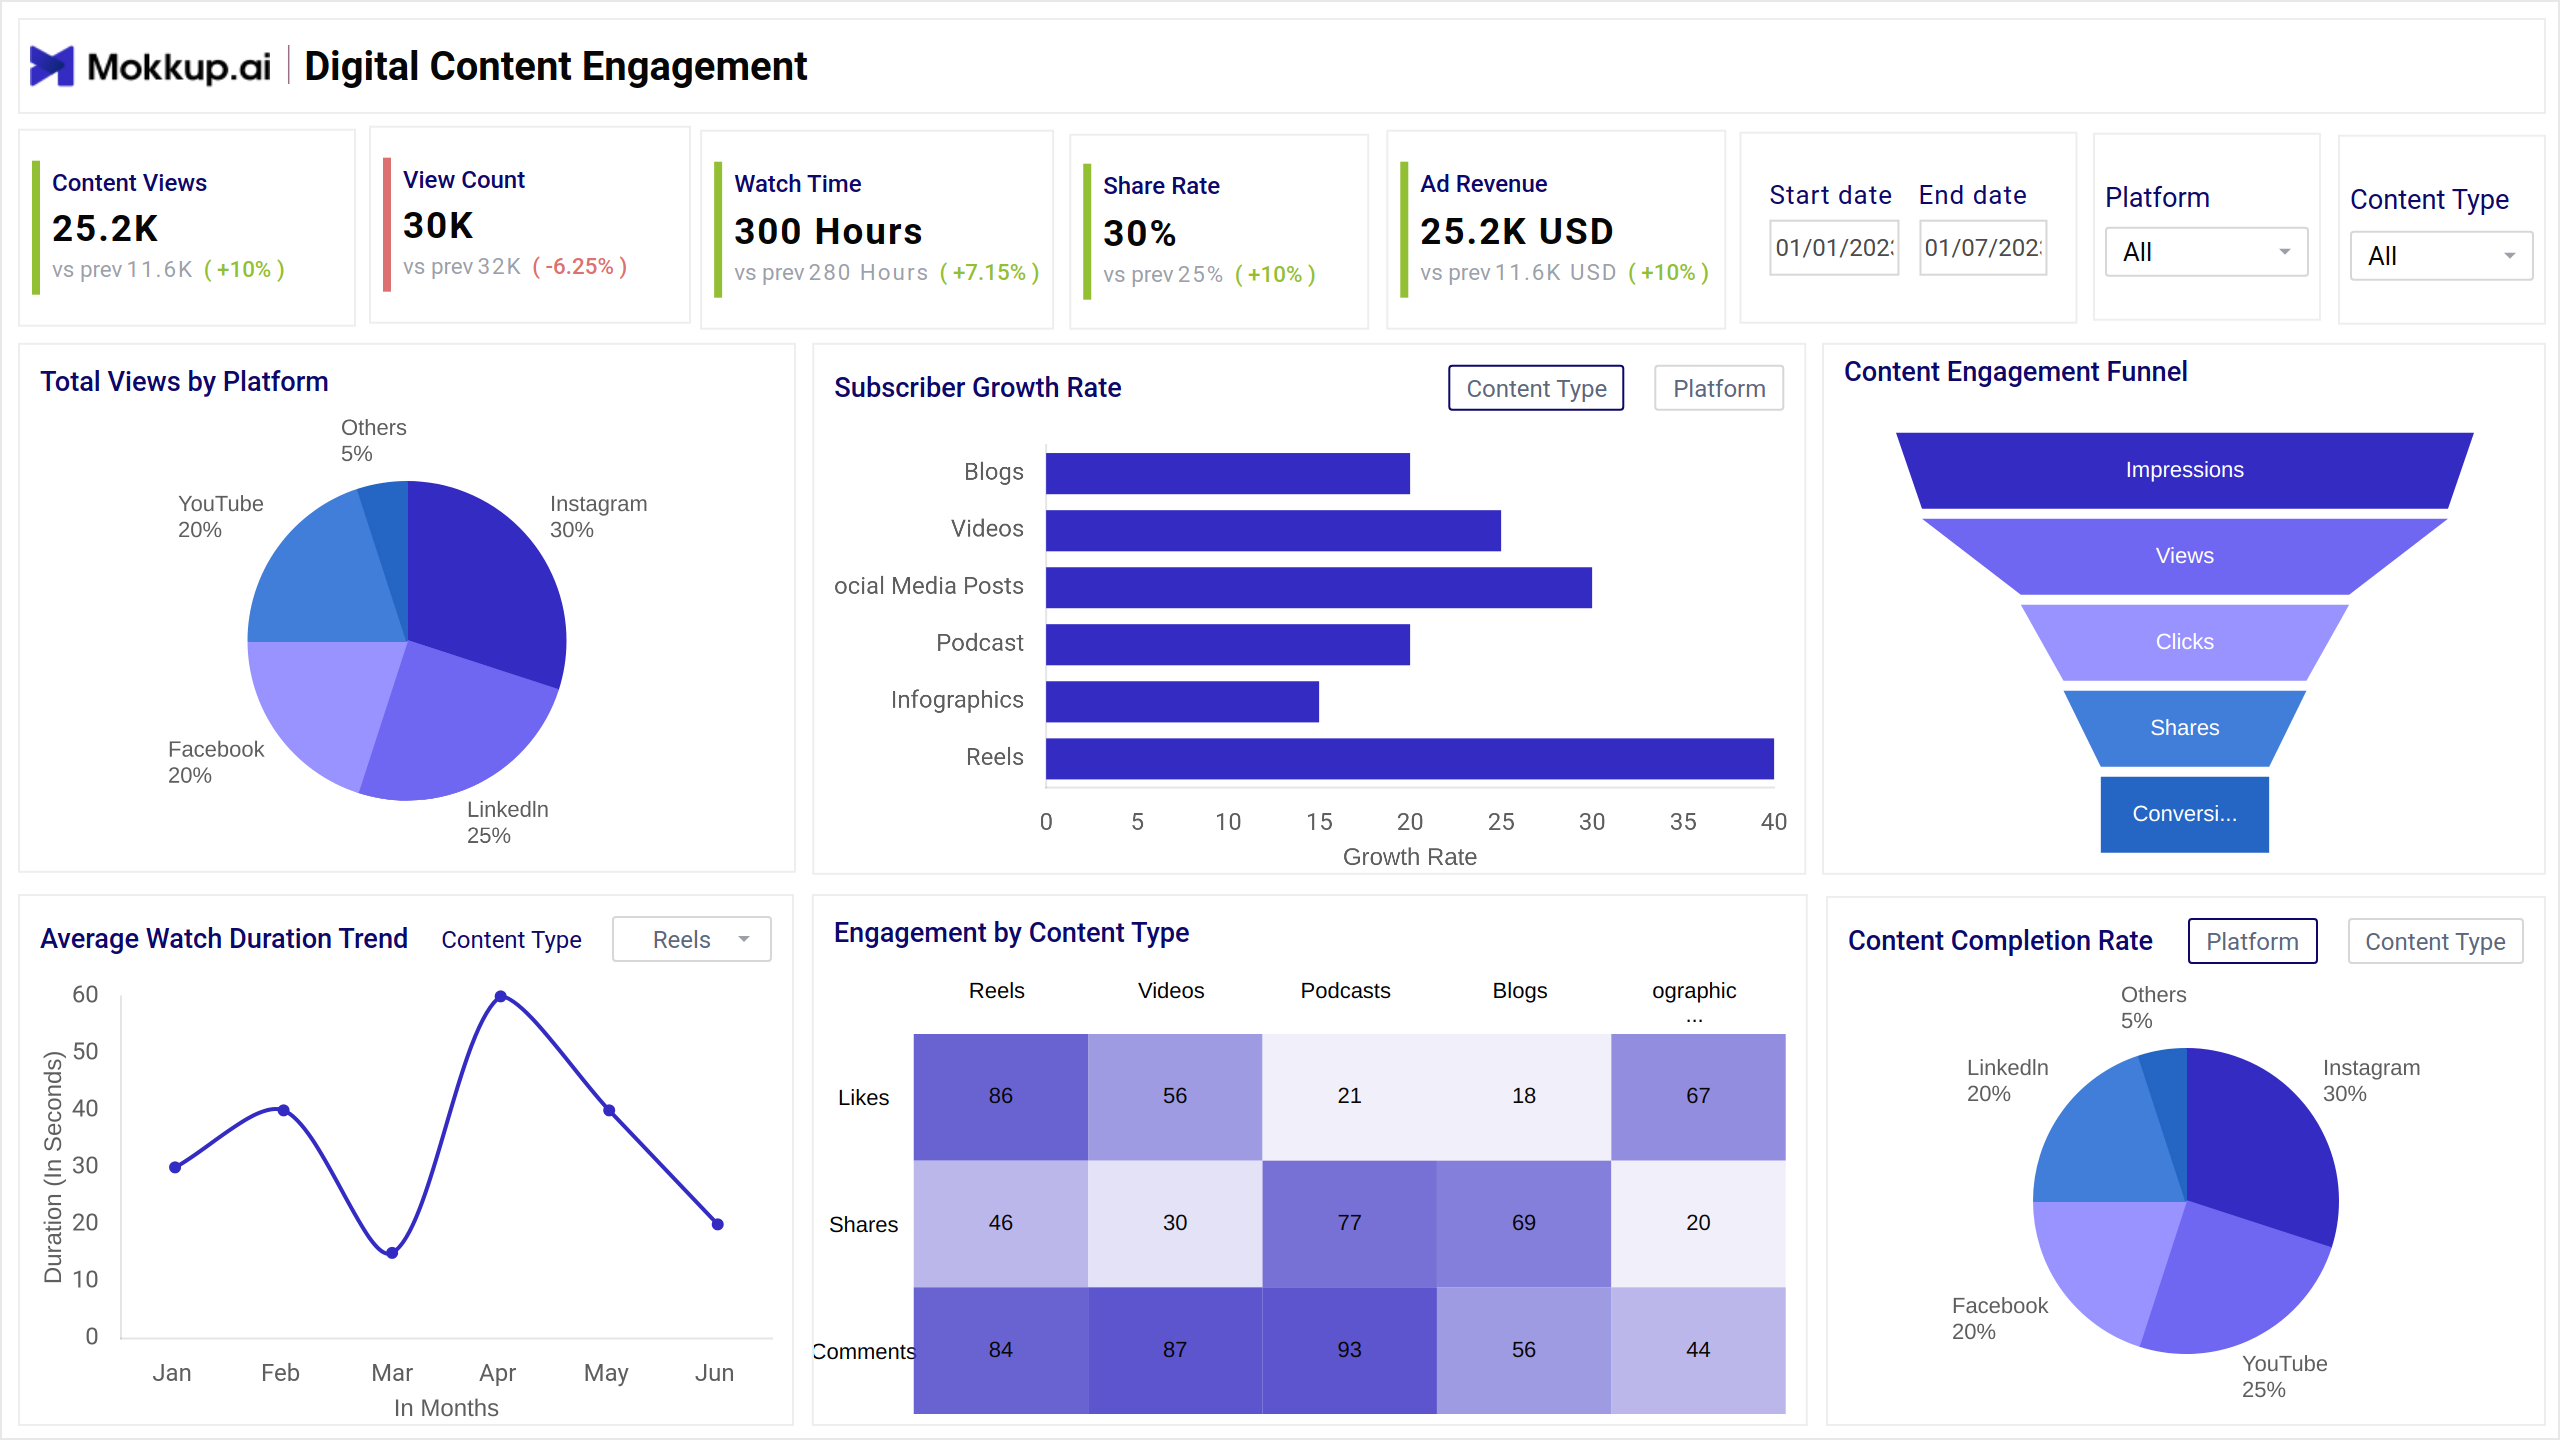
- Content Views: Tracks the total number of times content has been viewed across all platforms.
- View Count: Represents individual views for each piece of content.
- Watch Time: Measures how much time users spend engaging with your content.
- Share Rate: Displays the percentage of viewers who shared your content.
- Ad Revenue: Shows the income generated through advertisements on your content.
- Total Views by Platform: Compares the distribution of views across platforms to identify the most effective channels.
- Subscriber Growth Rate: Monitors subscriber growth trends over time to help evaluate marketing and outreach initiatives.
- Content Engagement Funnel: Visualizes the audience journey from discovering content to completing it, highlighting areas for optimization.
- Average Watch Duration Trend: Shows audience retention trends, which provide insight into content engagement over time.
- Engagement by Content Type: Analyzes engagement across different types of content, such as tutorials, reviews, or entertainment, to help enhance content strategies.
- Content Completion Rate: Displays how often viewers complete content, aiding in understanding the effectiveness of different content lengths.
Dashboard Template Insights
The dashboard wireframe offers insights for optimizing content strategies and audience engagement.
- Monitors total content views, view count, and watch time across multiple platforms.
- Tracks engagement trends across platforms and content types.
- Tracks subscriber growth rates over time.
- Displays audience involvement stages using a content engagement funnel.
- Analyzes average watch duration trends to determine content retention.
- Demonstrates progress towards content completion rates.
- Compares engagement and performance metrics for various content categories.
Conclusion
The Digital Content Engagement Dashboard template provides a comprehensive view of content performance, audience engagement, and platform-specific trends. It tracks key metrics like total views, watch time, and subscriber growth while providing detailed insights into audience behavior through engagement funnels, duration trends, and platform comparisons. This helps organizations refine strategies, optimize content, and improve retention and completion rates effectively.