What is a Christmas Food & Beverage Seasonal Menu Performance Dashboard?
A Christmas Food & Beverage Seasonal Menu Performance Dashboard template is a specialized analytics tool designed to evaluate and optimize the financial and operational success of holiday-specific culinary offerings. It consolidates key metrics such as festive menu sales, profit per dish, food waste, and customer ratings into a single visual platform.
By integrating festive menu profitability analysis, holiday food waste tracking, and seasonal menu sales optimization, the dashboard helps restaurant managers, chefs, and operators identify top-selling items, maximize margins, and reduce inefficiencies. The dashboard wireframe acts as a central hub for analyzing item-level performance, understanding customer preferences, and making data-driven decisions for menu engineering during the Christmas period.
How to Create a Christmas Food & Beverage Seasonal Menu Performance Dashboard
You don’t need to build your report from scratch—just start with a ready-to-use Christmas Food & Beverage Seasonal Menu Performance dashboard template from Mokkup. Add in your data and export it however you like. Here’s how to do it:
1. Create or Log in to Your Mokkup Account
Start by signing up on Mokkup.ai using your email. If you already have an account, just log in, and you’ll be good to go.
2. Choose and Customize Your Dashboard Template
Find the Christmas Food & Beverage Seasonal Menu Performance Dashboard template in the Templates section. Use the drag-and-drop editor to adjust KPIs, edit filters, or add elements based on your data.
3. Export to Your BI Tool
Once your dashboard wireframe is ready, use the BI Tool Export feature to send it directly to Power BI or Tableau for further analysis and enhancements. You can also download the dashboard as a PDF, PNG, or JPEG, embed it on a platform, or invite your team to collaborate.
Note: This is a Pro template. You’ll need a Pro subscription on Mokkup to use and customize this dashboard wireframe. Upgrade anytime to unlock full access.
Christmas Food & Beverage Seasonal Menu Performance Dashboard Example
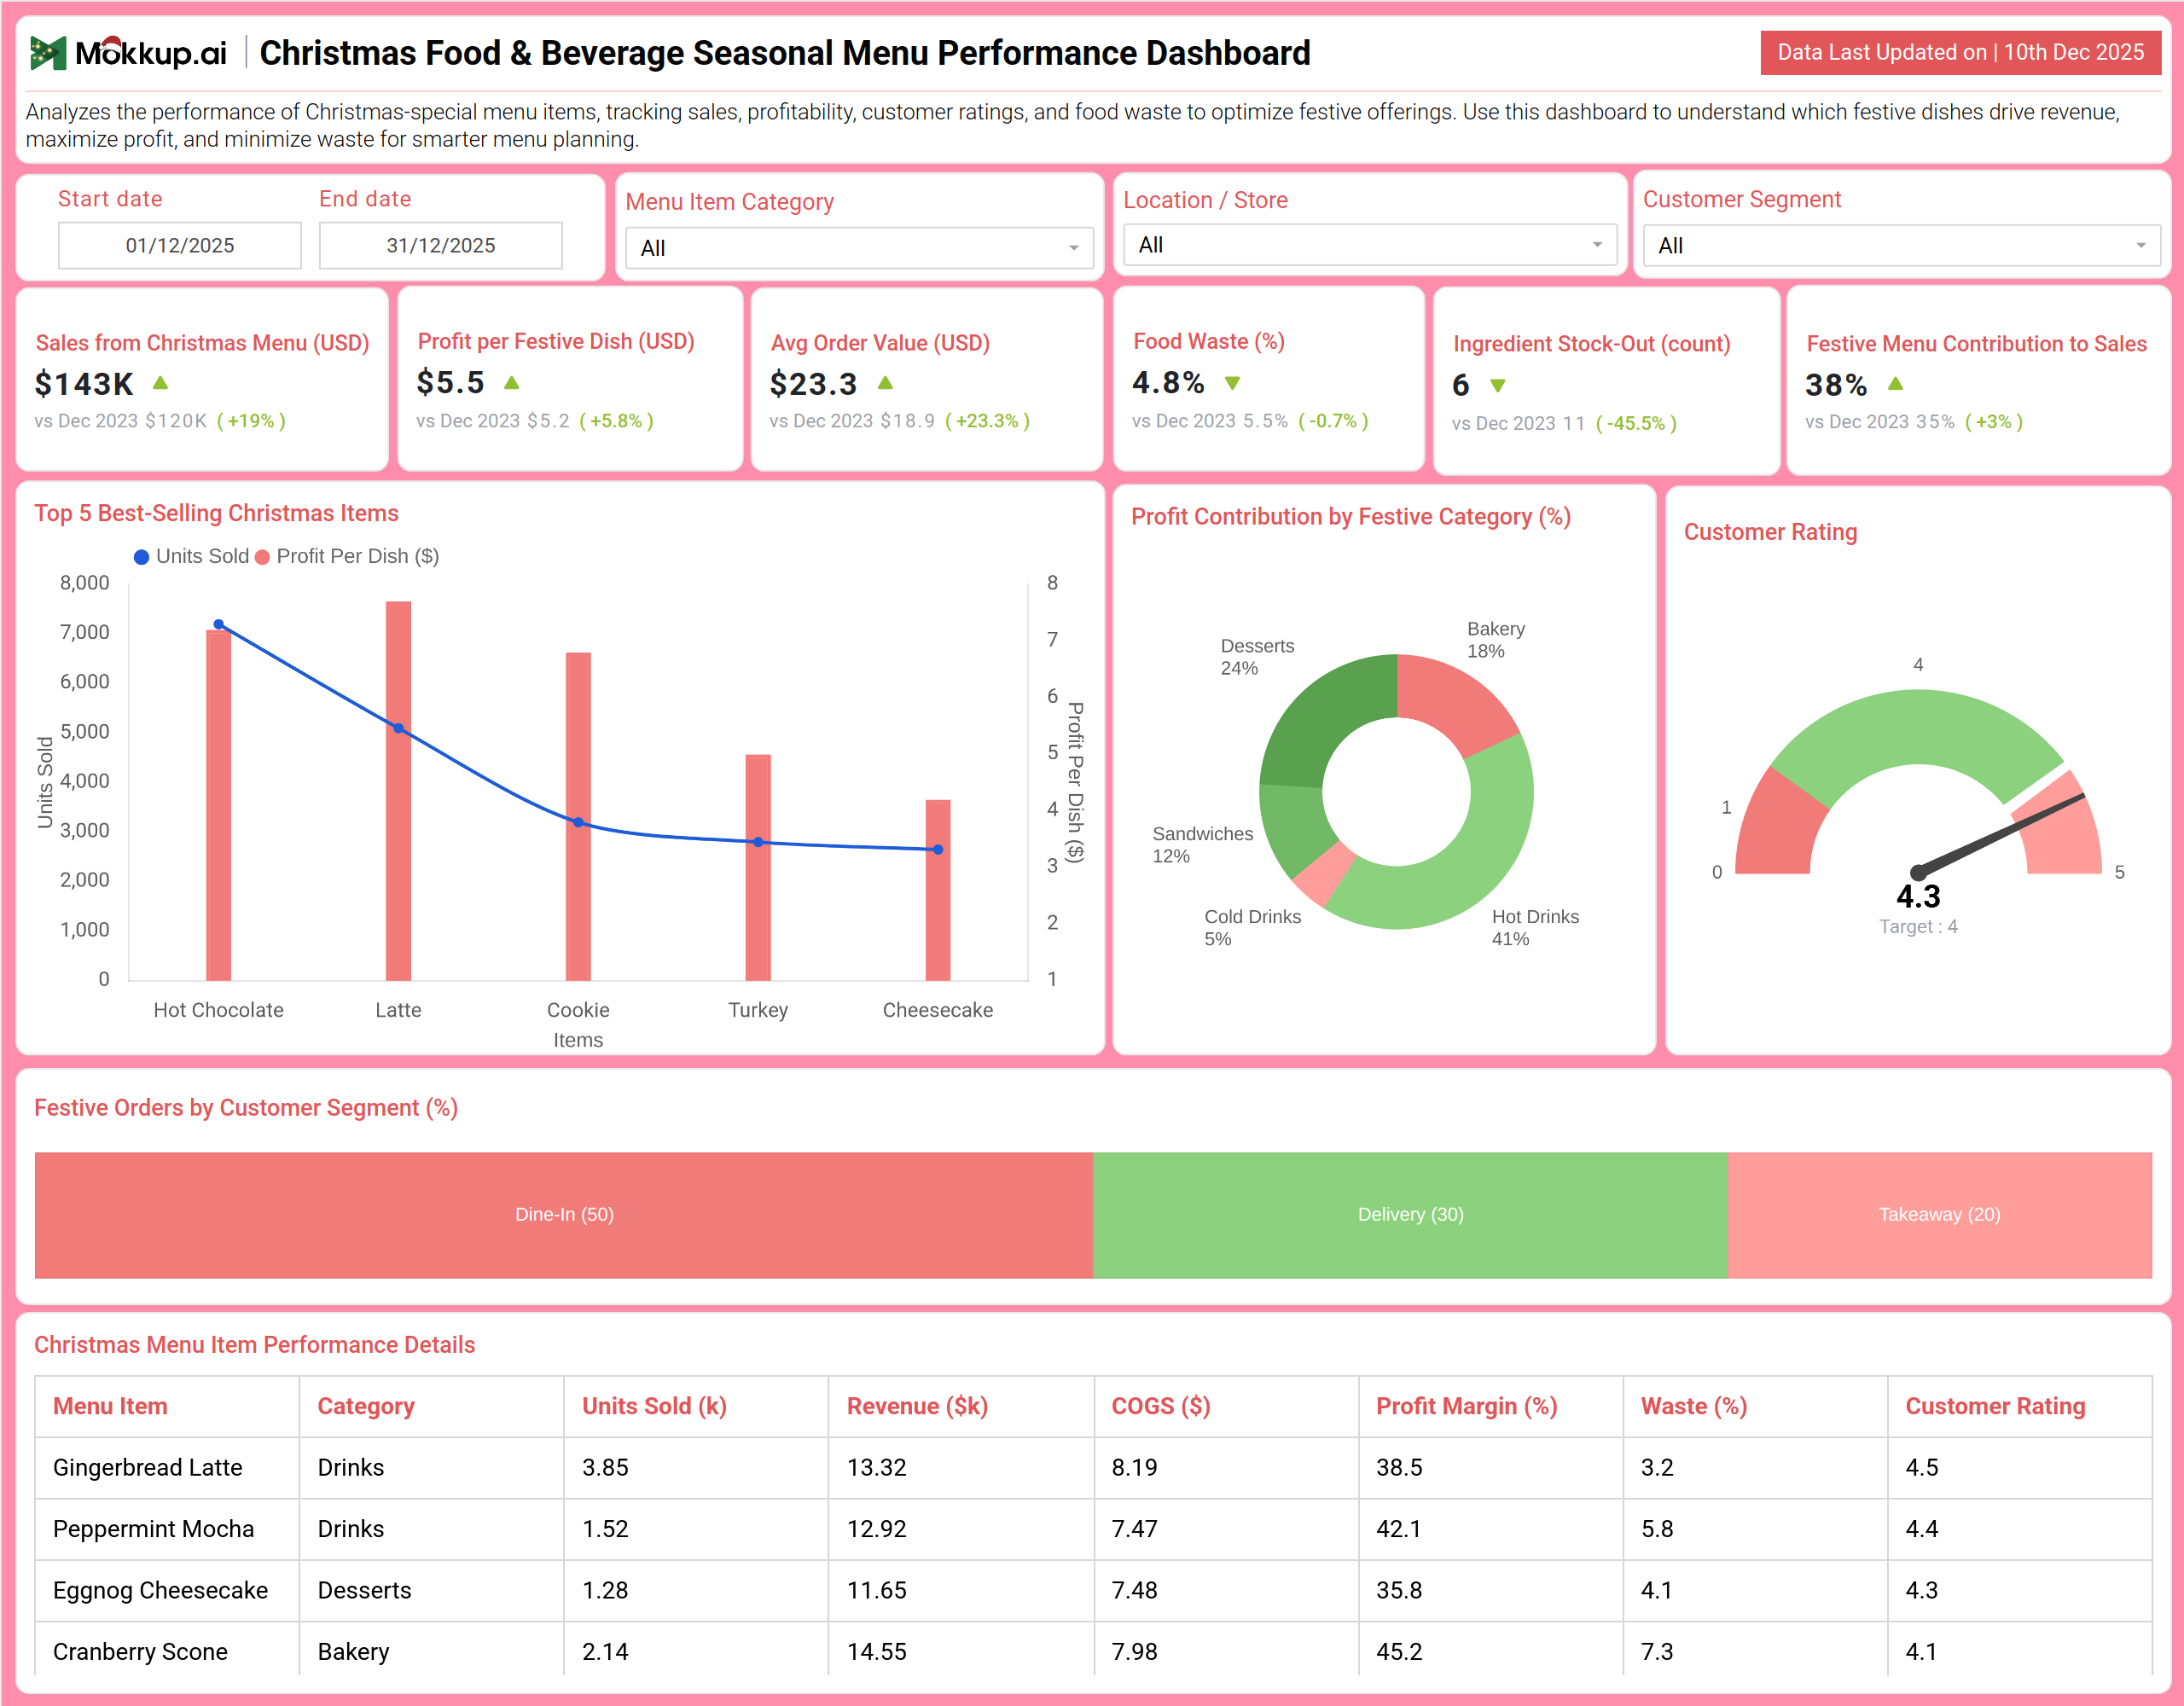
You can create a Christmas Food & Beverage Seasonal Menu Performance Dashboard that brings together sales performance, profitability, and operational efficiency into a unified view. A typical dashboard includes a Performance Overview section, where users can track Sales from Christmas Menu, Profit per Festive Dish, and Food Waste percentage. Visual charts, such as Top 5 Best-Selling Christmas Items and Profit Contribution by Festive Category, reveal revenue drivers and high-margin segments. The Menu & Profitability Analysis section builds on this by displaying Festive Orders by Customer Segment and a detailed Christmas Menu Item Performance Details table. Together, these modules deliver crucial holiday menu item analytics, enabling teams to refine offerings, adjust pricing, and optimize inventory for the next festive season.
How to Analyze Data in Christmas Food & Beverage Seasonal Menu Performance Dashboard
Here is how you can analyze data from this dashboard:
- Christmas Menu Sales Performance: Monitor sales from the Christmas menu to measure total revenue generated by festive items.
- Profitability by Festive Dish: Track profit per festive dish to evaluate average margins and identify high-performing items.
- Average Order Value (AOV): Analyze average order value to see if seasonal menus are driving higher customer spend.
- Food Waste Efficiency: Review food waste percentage to assess ingredient usage and preparation efficiency.
- Ingredient Availability: Measure ingredient stock-outs to identify supply gaps that may impact menu availability.
- Festive Revenue Contribution: Observe the contribution of festive menus to total sales to understand their overall business impact.
- Best-Selling Festive Items: Study the top 5 best-selling items to ensure adequate stocking and targeted promotions.
- Category-Level Profit Contribution: Examine profit contribution by category, such as desserts or hot drinks, to spot top-performing segments.
- Customer Satisfaction Insights: Evaluate customer ratings to understand customer satisfaction with festive offerings.
- Customer Segment Performance: Assess festive orders by customer segment to identify demand across dine-in, takeaway, and delivery channels.
Benefits of Christmas Food & Beverage Seasonal Menu Performance Dashboard
The following are the benefits of using this dashboard:
- Centralized Menu Performance Visibility: Provides a unified view of sales, profit, waste, and customer feedback for all festive items.
- Festive Profitability Optimization: Supports seasonal menu profitability analysis to highlight high-margin dishes and refine pricing.
- Improved Inventory Control: Enhances inventory planning through food waste tracking and monitoring of ingredient stock-outs.
- Enhanced Customer Experience: Identifies top-rated festive items and preferred customer segments to improve menu appeal.
- Revenue Growth Enablement: Increases holiday revenue by optimizing promotions around best-selling and high-profit items.
- Integrated Seasonal Analytics: Strengthens holiday menu analytics by combining financial, operational, and customer insights.
- Reduced Reporting Effort: Minimizes manual reporting by automating the tracking of seasonal menu KPIs.
- Future Menu Planning Support: Utilizes historical insights to inform data-driven festive menu planning for future seasons.
KPIs to Track in Christmas Food & Beverage Seasonal Menu Performance Dashboard
The following key KPIs can be tracked by using this dashboard:
- Sales from Christmas Menu (USD): The total revenue generated from the sale of festive, holiday-specific food and beverage items.
- Profit per Festive Dish (USD): The average net profit earned from each unit of a seasonal menu item sold.
- Average Order Value - AOV (USD): The average amount spent by a customer per transaction during the festive period.
- Food Waste (%): The percentage of prepared food for the festive menu that was unused or discarded.
- Ingredient Stock-Outs (count): The number of times a key ingredient for a festive item was unavailable, preventing its sale.
- Festive Menu Contribution to Sales (%): The percentage of total sales attributed to the seasonal holiday menu.
- Customer Rating (Score): The average customer satisfaction score for festive menu items, typically on a scale (e.g., 1-5).
- Menu Item Profit Margin (%): The profitability of an individual festive dish, calculated as (Revenue - Cost) / Revenue.
Frequently Asked Questions
Q1. What is the purpose of this menu performance dashboard?
It helps restaurant and café operators, chefs, and managers measure the success of their Christmas menu, identify profitable dishes, reduce waste, and understand customer preferences to optimize seasonal offerings.
Q2. Can the dashboard show which holiday drink is most profitable?
Yes. The detailed Menu Item Performance table shows profit margin for each item, and the Profit Contribution chart highlights which categories (like Hot Drinks) drive earnings.
Q3. How does the dashboard help reduce food waste?
By tracking the Food Waste percentage for the festive menu and for individual items, it identifies preparation or ordering inefficiencies that lead to spoilage.
Q4. Does it track customer feedback on seasonal items?
Yes. The Customer Rating metric provides direct insight into how well each festive item is received by guests.
Q5. Who uses this dashboard?
Restaurant Managers, Head Chefs, Food & Beverage Directors, Marketing Managers, and Inventory Controllers.