
What is a Christmas Event Management Planning Dashboard?
A Christmas Event Management Planning Dashboard is a comprehensive project management and financial tool designed to oversee and optimize all aspects of corporate holiday event planning. It consolidates key metrics such as event readiness, budget utilization, vendor performance, and guest RSVPs into a single visual platform. By integrating Christmas event planning analytics, holiday vendor performance tracking, and corporate event budget management, the dashboard empowers event teams to ensure seamless execution, control costs, and deliver exceptional attendee experiences. The dashboard acts as a central command center for tracking task completion, managing vendor contracts, and monitoring financial allocations throughout the event lifecycle.
How to Create a Christmas Event Management Planning Dashboard
You don’t need to build your report from scratch—just start with a ready-to-use dashboard template from Mokkup. Add in your data and export it however you like. Here’s how to do it:
1. Create or Log in to Your Mokkup Account
Start by signing up on Mokkup.ai using your email. If you already have an account, just log in, and you’ll be good to go.
2. Choose and Customize Your Dashboard Template
Find the Christmas Event Management Planning Dashboard template in the Templates section. Use the drag-and-drop editor to adjust KPIs, edit filters, or add elements based on your data.
3. Export to Your BI Tool
Once your dashboard wireframe is ready, use the BI Tool Export feature to send it directly to Power BI or Tableau for further analysis and enhancements. You can also download the dashboard as a PDF, PNG, or JPEG, embed it on a platform, or invite your team to collaborate.
Note: This is a Pro template. You’ll need a Pro subscription on Mokkup to use and customize this dashboard wireframe. Upgrade anytime to unlock full access.
Christmas Event Management Planning Dashboard Example
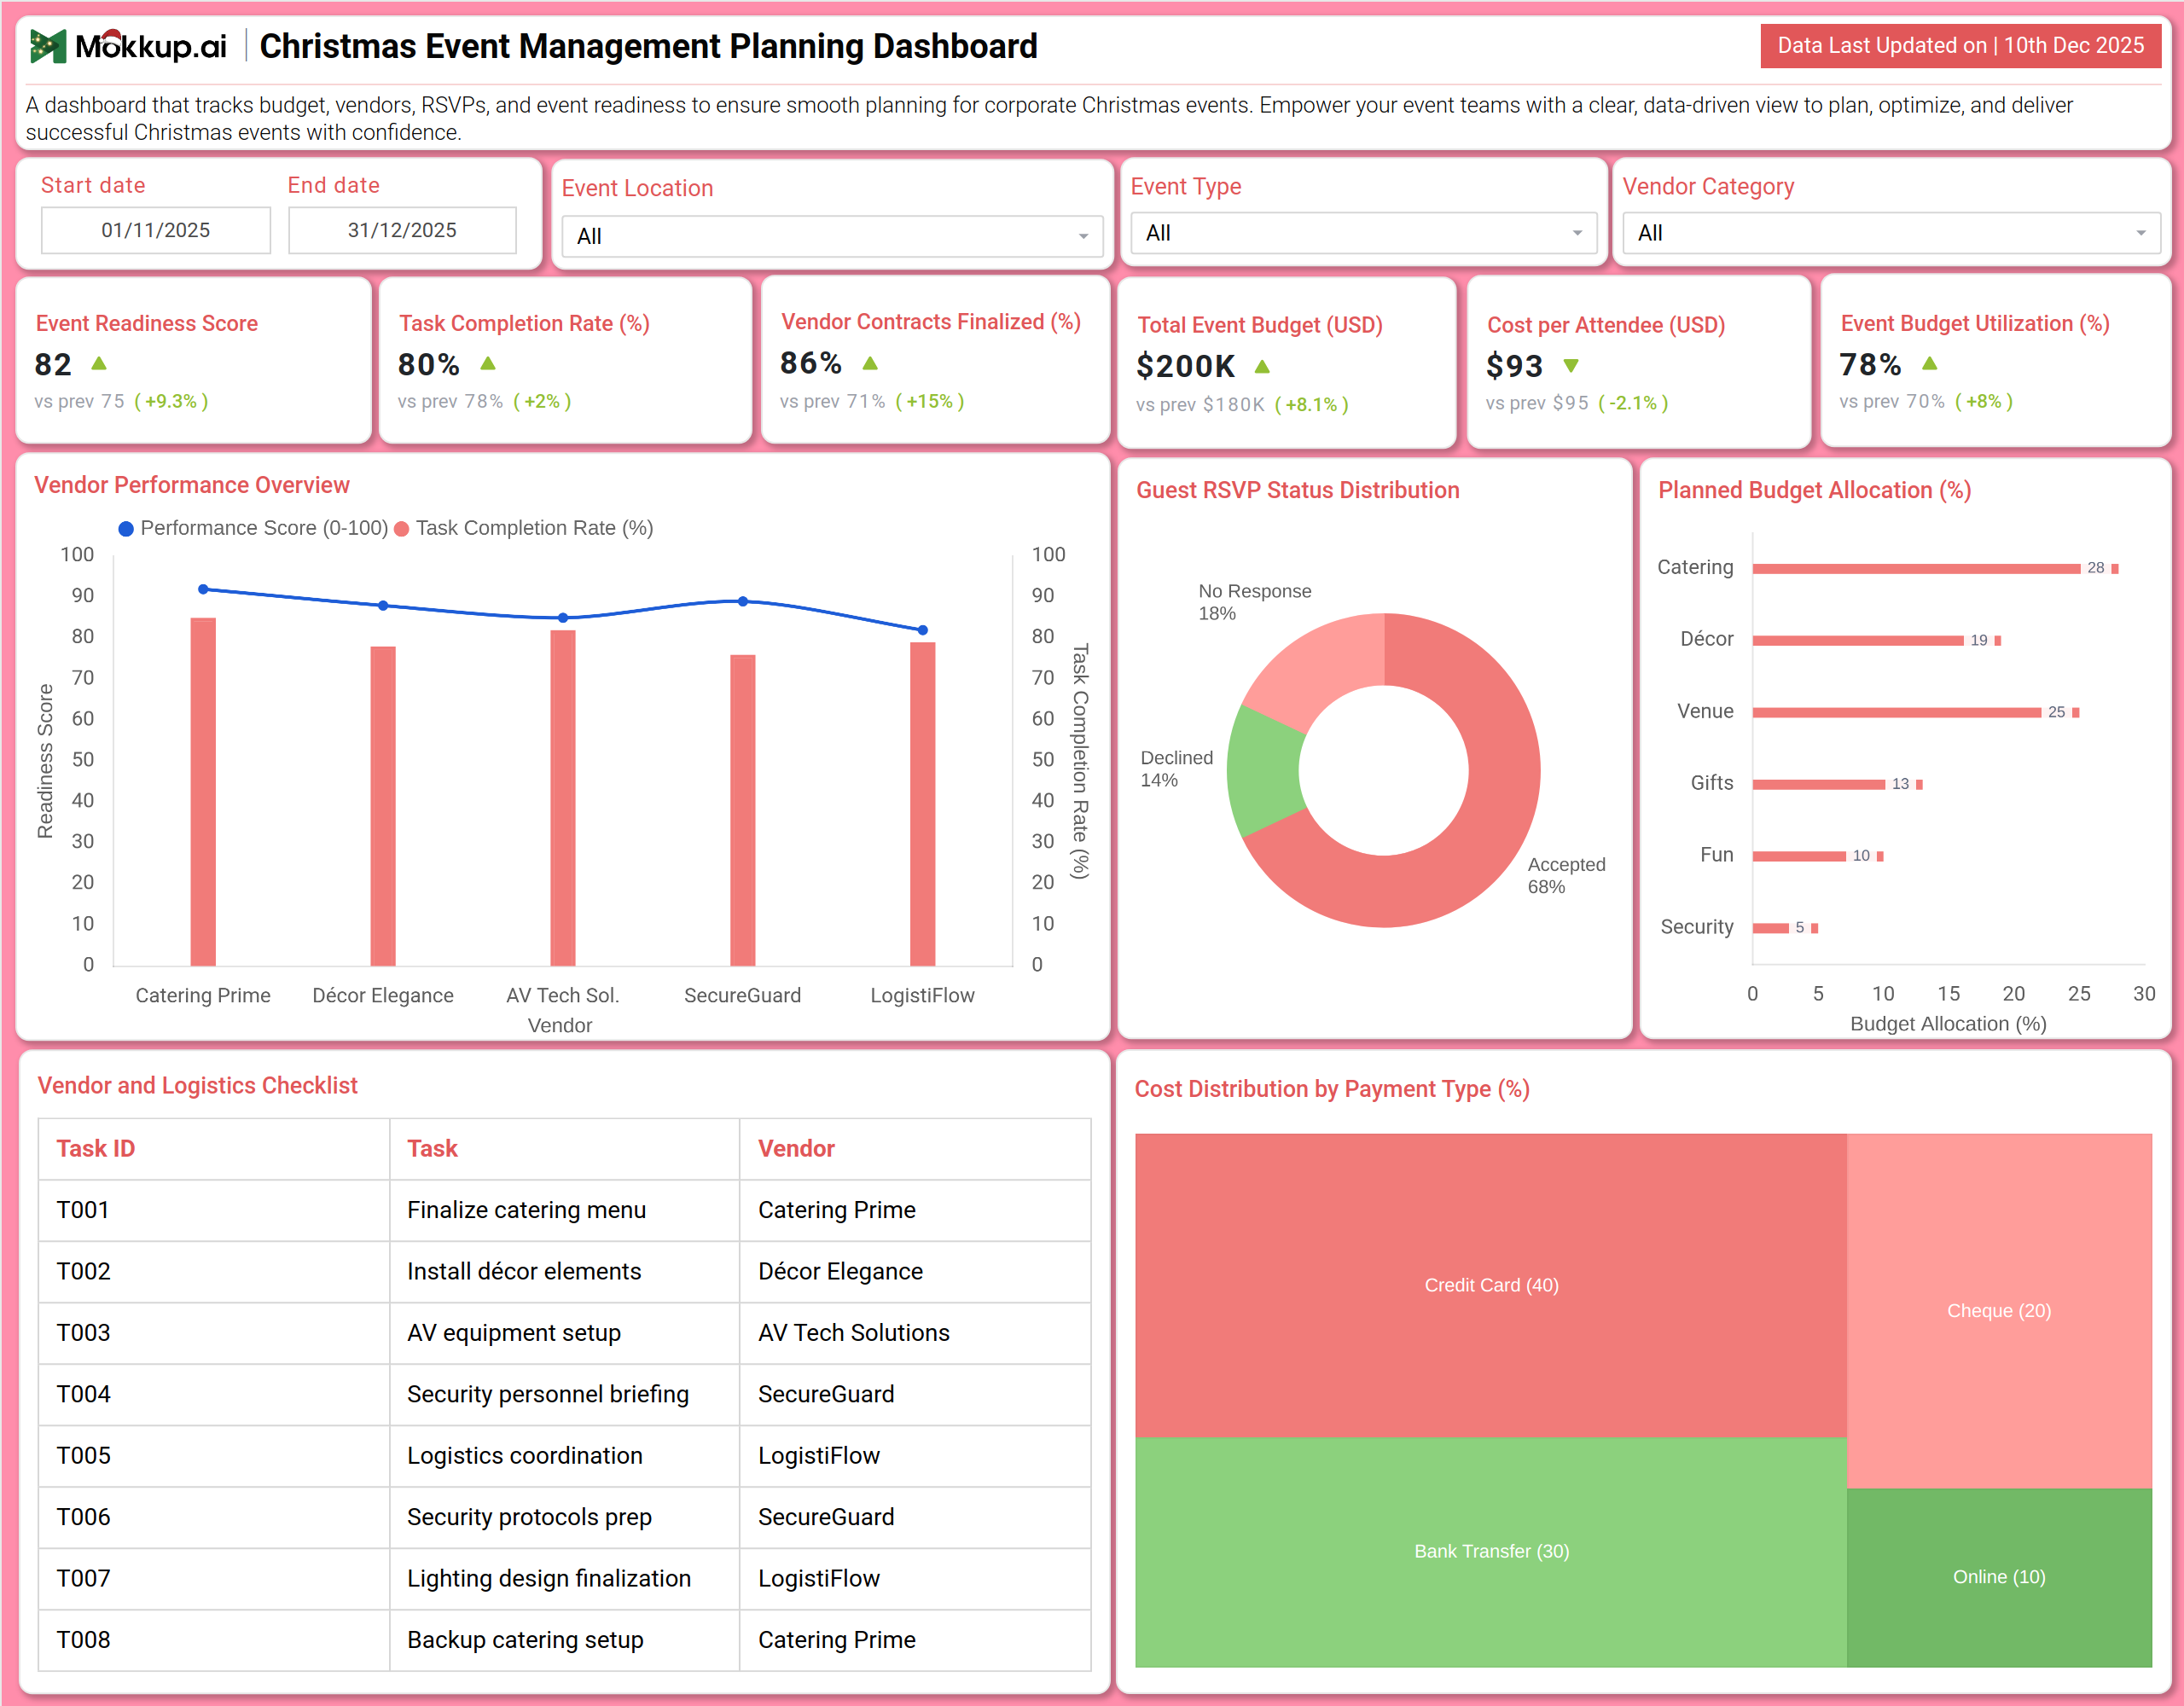
You can create a Christmas Event Management Planning Dashboard that brings together planning progress, financial oversight, and vendor management into a unified view. A typical dashboard includes a Planning Overview section, where users can track the Event Readiness Score, Task Completion Rate, and Total Event Budget. Visual charts, such as Vendor Performance Overview and Guest RSVP Status Distribution, provide valuable insights into partner reliability and attendee engagement. The Vendor & Budget Analysis section builds on this by displaying Planned Budget Allocation across categories, a detailed Vendor and Logistics Checklist, and Cost Distribution by Payment Type. Together, these modules deliver crucial holiday event success metrics, enabling planners to proactively address risks, stay within budget, and ensure all logistical elements are on track.
How to Analyze Data in the Christmas Event Management Planning Dashboard
Here is how you can analyze data from this dashboard:
- Event Readiness Score: Offers a high-level view of an event's preparedness, enabling planners to identify gaps or areas that require immediate attention.
- Task Completion Rate: Tracks whether critical pre-event tasks and milestones are being completed on time, reducing the risk of last-minute delays.
- Vendor Contracts Finalized: Shows progress in confirming vendors and service providers, ensuring all essential partnerships are secured ahead of the event.
- Total Event Budget: Provides clarity on the overall financial scope of the Christmas event, enabling stakeholders to understand budget limits and allocations.
- Cost per Attendee: Evaluates spending efficiency by measuring the average cost incurred per attendee, which helps benchmark against past or similar events.
- Event Budget Utilization: Monitors how much of the allocated budget has been spent or committed, enabling better cost control and financial discipline.
- Vendor Performance Overview: Evaluates the reliability and quality of vendors, including caterers, decorators, and AV teams, to ensure a seamless event execution.
- Guest RSVP Status: Tracks expected attendance by monitoring responses, helping teams finalize seating, catering, and capacity planning.
- Planned Budget Allocation: Analyzes how the budget is distributed across categories to ensure spending aligns with event priorities and objectives.
- Vendor and Logistics Checklist: Provides a real-time snapshot of pending tasks and responsibilities, ensuring nothing falls through the cracks.
Benefits of Christmas Event Management Planning Dashboard
The following are the benefits of using this dashboard:
- Centralized Planning Visibility: Provides a unified view of all planning, financial, and operational metrics for improved coordination.
- Data-Driven Christmas Event Planning Analytics: Supports informed decision-making and proactive risk mitigation through real-time insights.
- Improved Budget Control: Enables effective corporate event budget management by tracking costs and utilization as plans evolve.
- Stronger Vendor Management: Enhances accountability and service quality through holiday vendor performance tracking.
- Higher Planning Efficiency: Reduces missed deadlines by clearly visualizing task progress and contract status.
- Better Attendee Experience Planning: Improves guest experience by aligning RSVP trends with cost-per-attendee insights.
- Reduced Manual Coordination Effort: Minimizes back-and-forth by consolidating checklists, budgets, and vendor details into a single dashboard.
- Greater Event Success Confidence: Uses a holistic readiness score to help teams focus efforts where they matter most.
KPIs to Track in a Christmas Event Management Planning Dashboard
The following key KPIs can be tracked by using this dashboard:
- Event Readiness Score: A composite index reflecting the overall completion status and risk level of event planning.
- Task Completion Rate (%): The percentage of planned pre-event tasks that have been marked as complete.
- Vendor Contracts Finalized (%): The percentage of required vendor agreements that have been signed and secured.
- Total Event Budget (USD): The total amount of money allocated for the event.
- Cost per Attendee (USD): The total event budget divided by the number of confirmed attendees.
- Event Budget Utilization (%): The percentage of the total budget that has been spent or committed.
- Vendor Performance Score: A rating (e.g., 0-100) for each key vendor based on reliability, quality, and communication.
- Guest Acceptance Rate (%): The percentage of guests who have confirmed their attendance.
Frequently Asked Questions
1. What is the purpose of this event planning dashboard?
It helps event managers, coordinators, and corporate planners oversee every detail of holiday event execution from budget and vendors to tasks and guest lists—ensuring a smooth, successful, and financially controlled event.
2. Can the dashboard indicate whether we are on track with our planning?
Yes. The Event Readiness Score and Task Completion Rate provide a clear, at-a-glance view of overall progress and remaining workload.
3. How does the dashboard assist in managing multiple vendors?
The Vendor Performance Overview chart and the detailed checklist allow for easy comparison and tracking of each vendor's tasks and performance.
4. Does it help control event spending?
Absolutely. By tracking Total Budget, Budget Utilization, and Cost per Attendee it provides continuous financial oversight to prevent overspending.