What is a Child Health & Immunization Dashboard?
A Child Health & Immunization Dashboard is a digital platform designed for hospitals, clinics, and public health institutions to track child health outcomes and vaccination coverage in real-time. It consolidates key data such as immunization rates, nutrition status, pediatric morbidity, and infant mortality into a single view. By utilizing interactive charts and metrics, healthcare teams can effectively monitor disease trends, enhance vaccination outreach, and ensure timely interventions. This real-time dashboard for pediatric health and vaccination tracking enhances decision-making, improves reporting accuracy, and supports child welfare programs effectively.
How to Create a Child Health & Immunization Dashboard
You don’t need to build your report from scratch—just start with a ready-to-use sample child health & immunization dashboard template from Mokkup. Add in your data and export it however you like. Here’s how to do it:
1. Create or Log in to Your Mokkup Account
Start by signing up on Mokkup.ai using your email. If you already have an account, just log in, and you’ll be good to go.
2. Choose and Customize Your Dashboard Template
Find the Child Health & Immunization Dashboard template in the Templates section. Use the drag-and-drop editor to adjust KPIs, edit filters, or add elements based on your data.
3. Export to Your BI Tool
Once your dashboard wireframe is ready, use the BI Tool Export feature to send it directly to Power BI or Tableau for further analysis and enhancements. You can also download the dashboard as a PDF, PNG, or JPEG, embed it on a platform, or invite your team to collaborate.
Note: This is a Pro template. You’ll need a Pro subscription on Mokkup to use and customize this dashboard wireframe. Upgrade anytime to unlock full access.
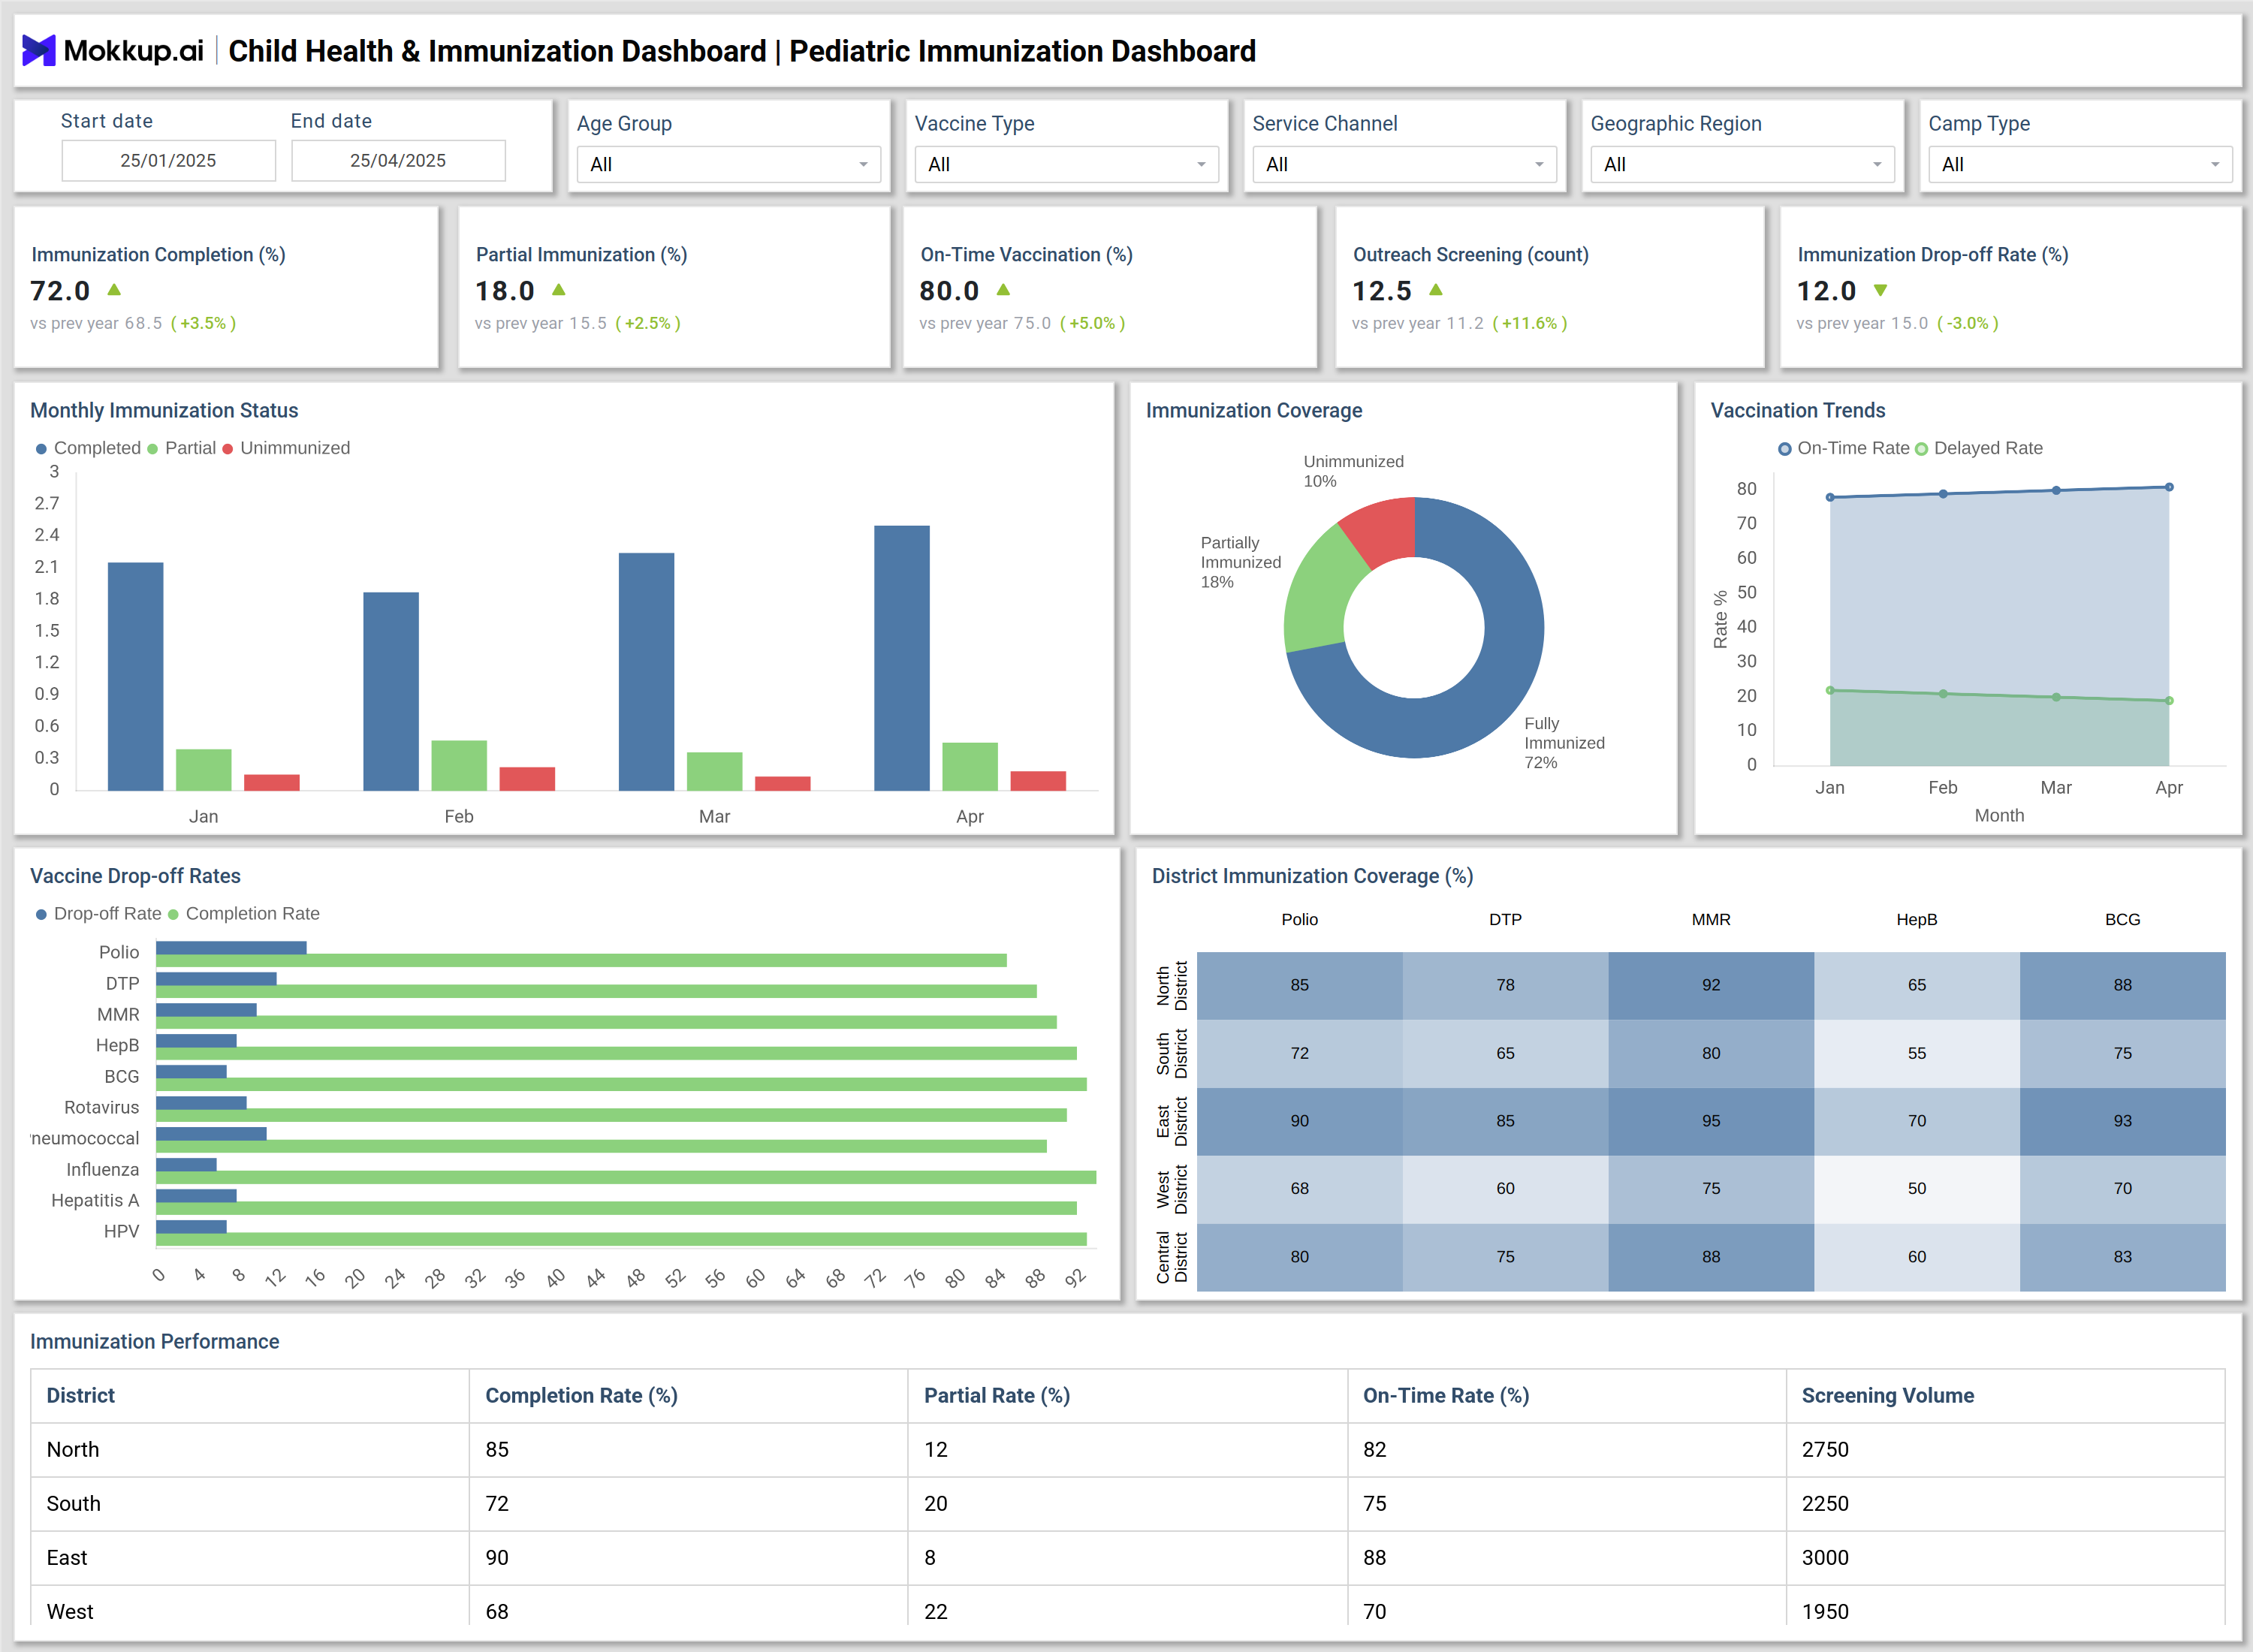
Child Health & Immunization Dashboard Example
You can create the best Child Health & Immunization Dashboard with two integrated views: one for pediatric health indicators and another for immunization performance. The health view monitors stunting, wasting, underweight cases, anemia prevalence, low birth weight, and mortality trends, supported by bar charts, line graphs, and regional heat maps. The immunization view tracks coverage levels, on-time vaccination rates, drop-off by vaccine type, and outreach camp effectiveness using donut charts, stacked columns, and district-level heat maps. Together, these dashboards act as a comprehensive tool for analyzing pediatric patient health and vaccination trends while supporting public health compliance.
How to Analyze Data in the Child Health & Immunization Dashboard
You can analyze data in the following ways:
- Monitor immunization completion: Compare full, partial, and non-immunized children to identify coverage gaps.
- Track on-time vaccination: Use line charts to analyze timely vs. delayed vaccinations.
- Review nutrition status: Measure stunting, wasting, and underweight prevalence by age group.
- Assess morbidity patterns: Break down cases of ARI, diarrhea, and malnutrition by age and region.
- Evaluate outreach impact: Compare children screened at camps with referral-to-treatment conversion rates.
- Analyze mortality trends: Track infant and under-5 mortality rates year over year for policy planning.
Benefits of Child Health & Immunization Dashboard
The following are benefits of child health data visualization and immunization reporting dashboard:
- Improved vaccination coverage: Ensures better monitoring of on-time and complete immunizations.
- Data-driven child health programs: Identify stunting, anemia, and morbidity patterns early.
- Efficient outreach planning: Tracks screening volumes and conversion rates from immunization camps.
- Real-time reporting: Provides instant updates for pediatric health indicators and vaccination trends.
- Better resource allocation: Supports health administrators in distributing vaccines and staff based on regional demand.
- Regulatory compliance: Simplifies reporting for public health programs and compliance audits.
KPIs to Track in Child Health & Immunization Dashboard
The key KPIs include:
- Immunization Completion Rate (%) → Percentage of children fully vaccinated.
- On-Time Vaccination Rate (%) → Timeliness of vaccine delivery.
- Drop-off Rate by Vaccine → Children missing second or subsequent doses.
- Nutrition Indicators → Stunting, wasting, and underweight prevalence.
- Anemia Prevalence (%) → Percentage of children with low hemoglobin.
- Low Birth Weight Rate (%) → Incidence of neonates under standard weight.
Frequently Asked Questions
1. Who should use a Child Health & Immunization Dashboard?
Public health agencies, maternity hospitals, pediatric clinics, and NGOs running child health programs.
2. Can this dashboard improve vaccination outreach?
Yes, it tracks on-time vaccination, district-level coverage, and drop-off rates, helping design better outreach strategies.
3. How does the dashboard help in child health monitoring?
It provides real-time insights into nutrition, morbidity, and mortality, enabling faster interventions for children at risk.