
What is a Carbon Footprint Dashboard?
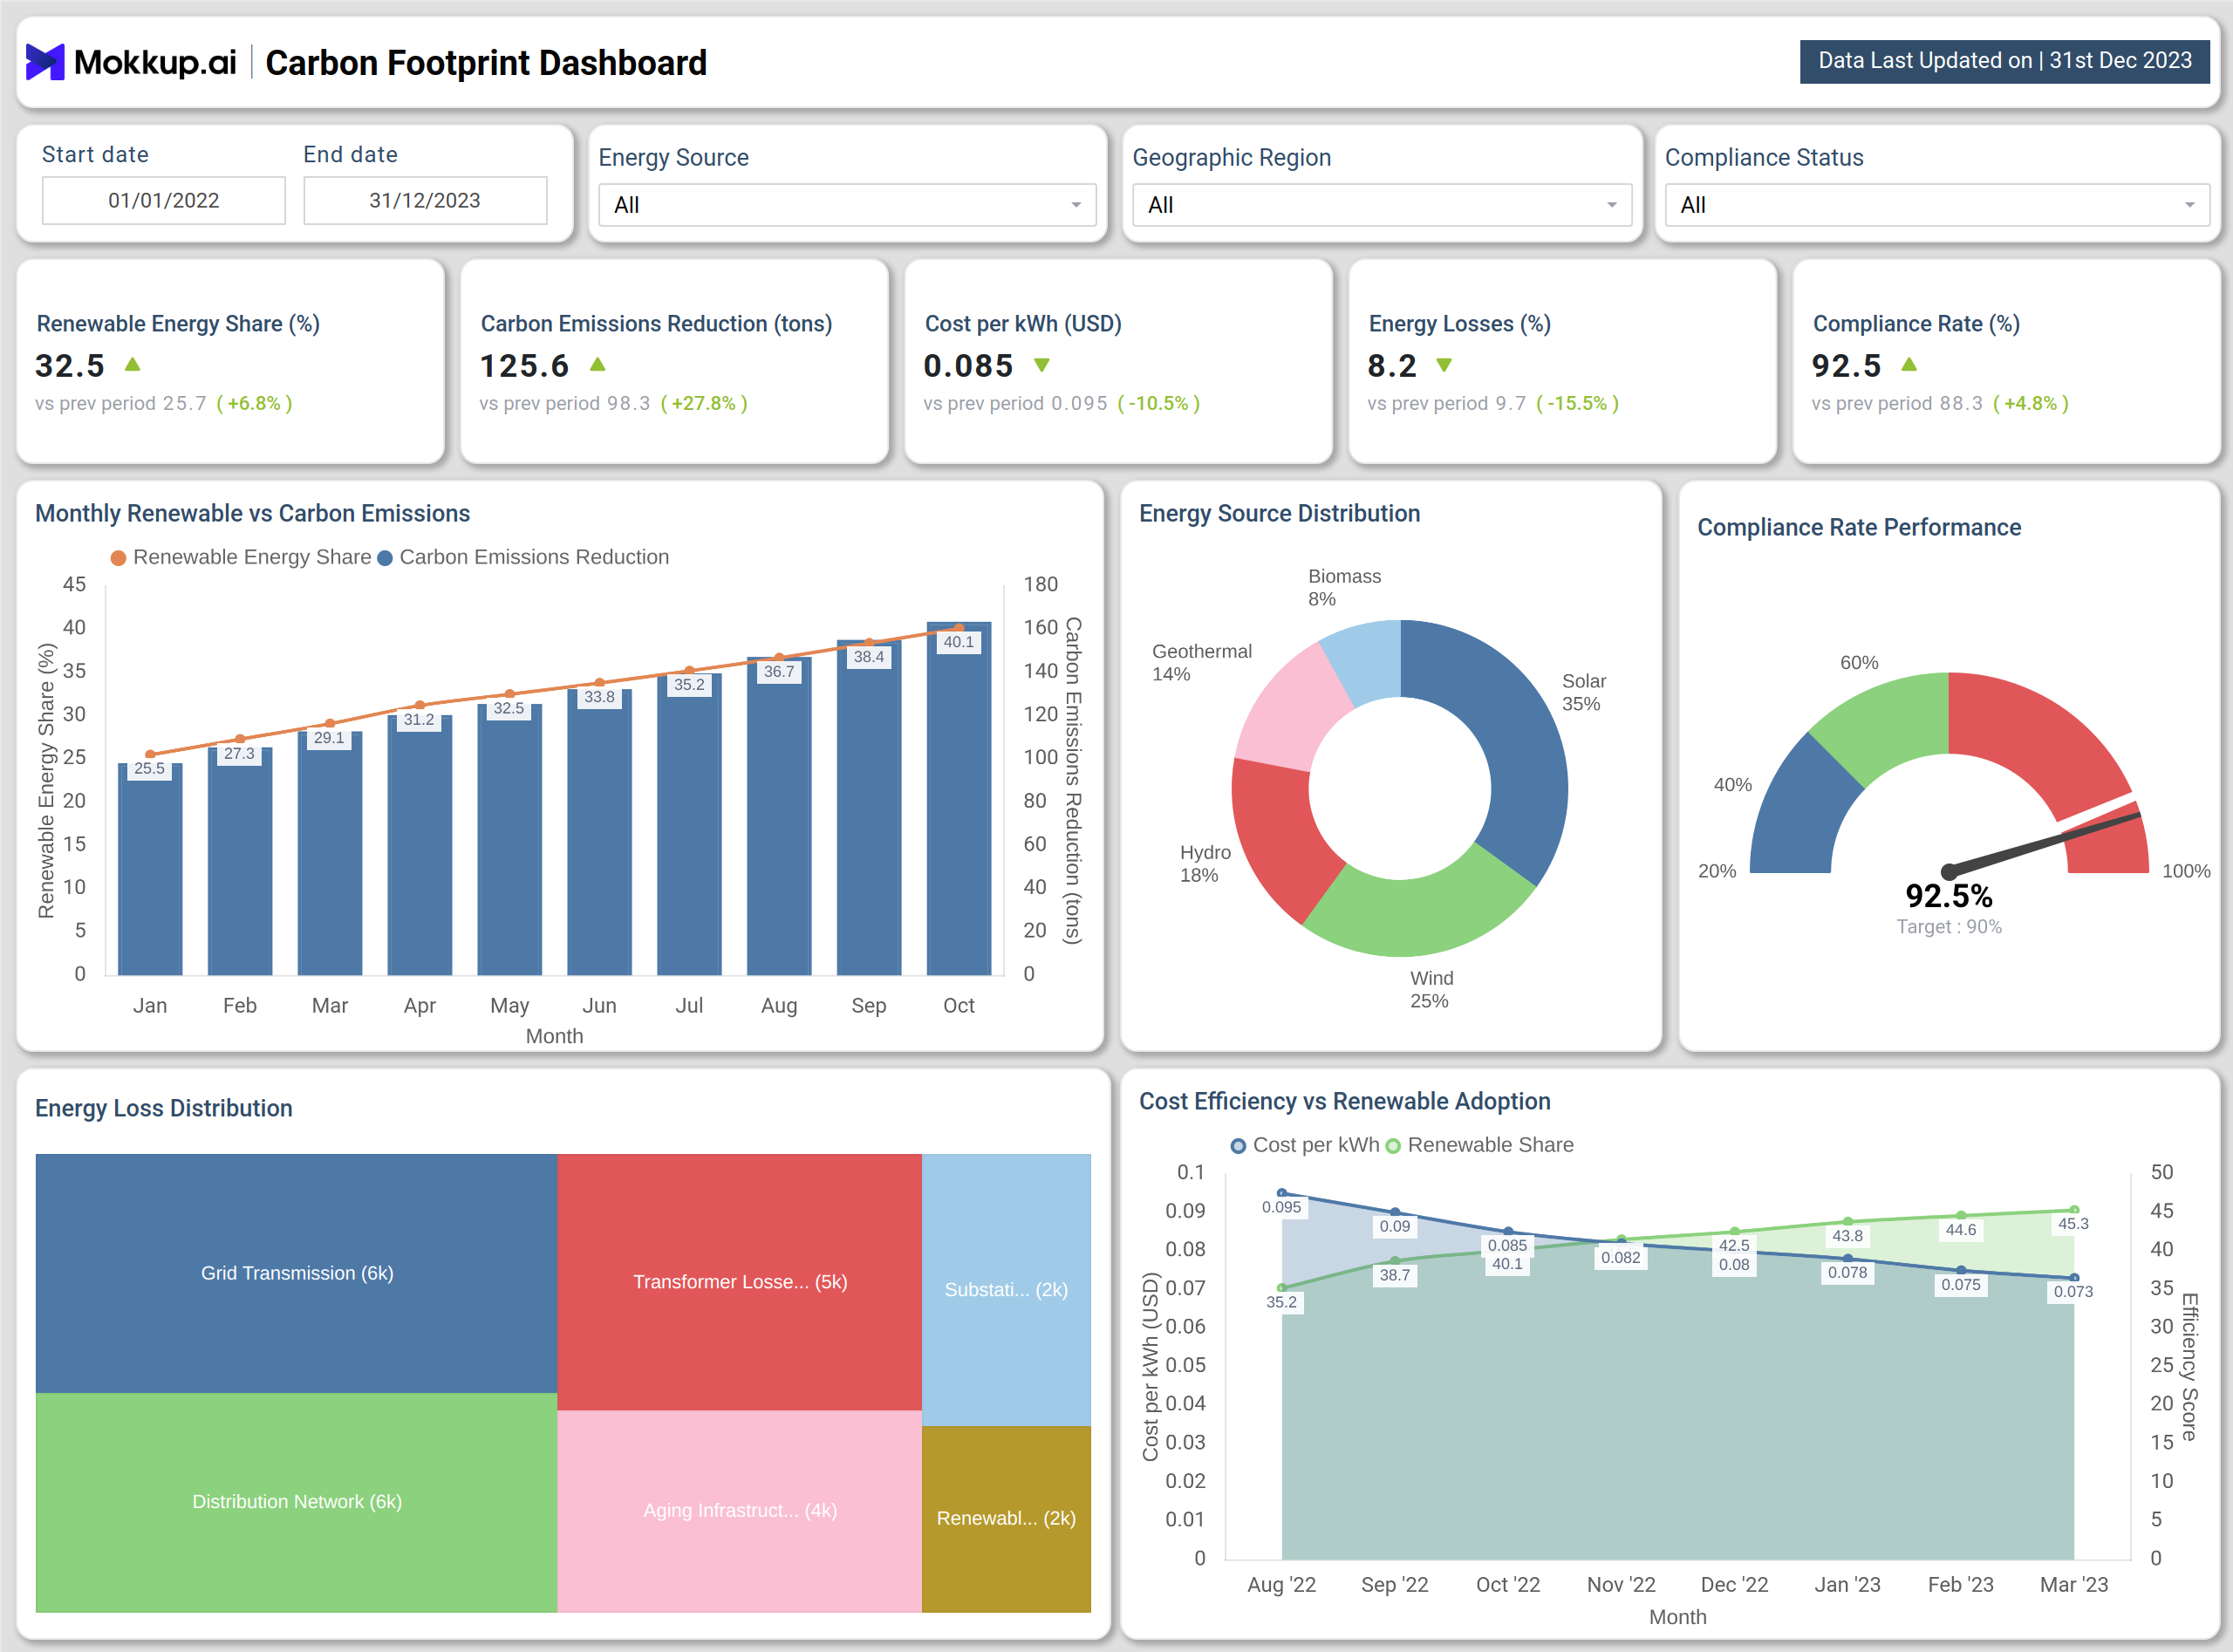
A Carbon Footprint Dashboard is a sustainability analytics tool that provides real-time visibility into emissions, renewable adoption, and compliance. It consolidates KPIs such as renewable energy share, carbon emissions reduction, cost per kWh, energy losses, and compliance rate.
The carbon footprint dashboard template centralizes data, allowing businesses to measure environmental performance, track progress toward carbon neutrality, and make informed decisions. This real-time carbon footprint monitoring dashboard is critical for industries with high energy use in reducing risks, improving efficiency, and meeting sustainability goals.
How To Create Carbon Footprint Dashboards
You don’t need to build your report from scratch—just start with a ready-to-use Carbon Footprint dashboard template from Mokkup. Add in your data and export it however you like. Here’s how to do it:
1. Create or Log in to Your Mokkup Account
Start by signing up on Mokkup.ai using your email. If you already have an account, just log in, and you’ll be good to go.
2. Choose and Customize Your Dashboard Template
Find the Carbon Footprint Dashboard Template in the Templates section. Use the drag-and-drop editor to adjust KPIs, edit filters, or add elements based on your data.
3. Export to Your BI Tool
Once your dashboard wireframe is ready, use the BI Tool Export feature to send it directly to Power BI or Tableau for further analysis and enhancements. You can also download the dashboard as a PDF, PNG, or JPEG, embed it on a platform, or invite your team to collaborate.
Note: This is a Pro template. You’ll need a Pro subscription on Mokkup to use and customize this dashboard wireframe. Upgrade anytime to unlock full access.
Carbon Footprint Dashboard Example
It combines multiple charts and visuals to provide insights at different levels. A renewable energy vs carbon emissions chart shows the relationship between renewable adoption and emission reduction. The energy source distribution pie chart breaks down solar, wind, hydro, biomass, and geothermal contributions, allowing businesses to analyze their energy mix. A compliance rate gauge tracks whether sustainability initiatives meet established targets, while an energy loss distribution heatmap helps identify inefficiencies across transmission and infrastructure. Finally, a cost efficiency vs renewable adoption trend chart connects financial outcomes with environmental strategies by showing how renewable growth impacts energy costs.
This occupational sustainability dashboard enables companies to integrate sustainability tracking into daily operations while balancing compliance, cost, and energy efficiency.
How to Analyze Data in Carbon Footprint Dashboard
To maximize value from a carbon footprint dashboard template, organizations should:
- Track Renewable Energy Share – Ensure renewable adoption increases consistently over time.
- Measure Carbon Emissions Reduction – Monitor emission decreases as renewables scale.
- Review Cost per kWh – Use the cost vs renewable adoption chart to track efficiency.
- Analyze Energy Loss Distribution – Identify weak points in transmission and infrastructure.
- Evaluate Compliance Rate – This functions as a compliance tracking dashboard, ensuring alignment with standards.
- Compare Across Regions and Sources – Apply filters to track energy mix performance.
- Link Performance with Investment – Treat the tool as an incident tracking and compliance dashboard to tie data to actions.
By analyzing these metrics, organizations can optimize energy use, reduce emissions, and ensure compliance with sustainability standards.
Benefits of Carbon Footprint Dashboard
Organizations gain several advantages by using a Carbon Footprint Dashboard:
- Emission Reduction: Track progress toward net-zero goals with a real-time carbon footprint monitoring dashboard.
- Compliance Alignment: A compliance tracking dashboard simplifies sustainability reporting and ensures regulatory adherence.
- Energy Mix Optimization: Monitor solar, wind, hydro, and biomass adoption for better planning.
- Cost Efficiency: The carbon footprint dashboard template shows how renewable growth lowers costs.
- Risk Identification: The occupational sustainability dashboard helps detect energy losses early.
- Data-Driven Strategy: An incident tracking and compliance dashboard supports more intelligent resource allocation.
This dashboard helps organizations reduce their carbon footprint while improving efficiency and compliance.
KPIs to Track in Carbon Footprint Dashboard
Key KPIs include:
- Renewable Energy Share (%) – Tracks the percentage of energy sourced from renewables such as solar, wind, and hydro.
- Carbon Emissions Reduction (tons) – This KPI measures the total decrease in greenhouse gas emissions over time.
- Cost per kWh (USD): This KPI evaluates average energy costs per unit consumed.
- Energy Losses (%): This metric identifies inefficiencies in transmission and distribution networks to pinpoint energy wastage.
- Compliance Rate (%) – Shows the level of alignment with environmental regulations and sustainability standards.
By monitoring these KPIs, businesses can achieve sustainability goals while improving operational efficiency.
Frequently Asked Questions
1. Why is a Carbon Footprint Dashboard important?
It provides real-time visibility into energy and emission KPIs, helping organizations reduce their carbon footprint, optimize energy use, and meet compliance requirements.
2. Which industries benefit most from Carbon Footprint Dashboards?
Due to their higher energy demands, manufacturing, energy, logistics, and corporate enterprises gain the most value from an occupational sustainability dashboard.
3. How does renewable adoption affect costs?
The cost efficiency vs renewable adoption chart shows that increasing the renewable share usually reduces the cost per kWh, supporting financial and environmental goals.