
What is a Boarding School Student Academic Performance Dashboard?
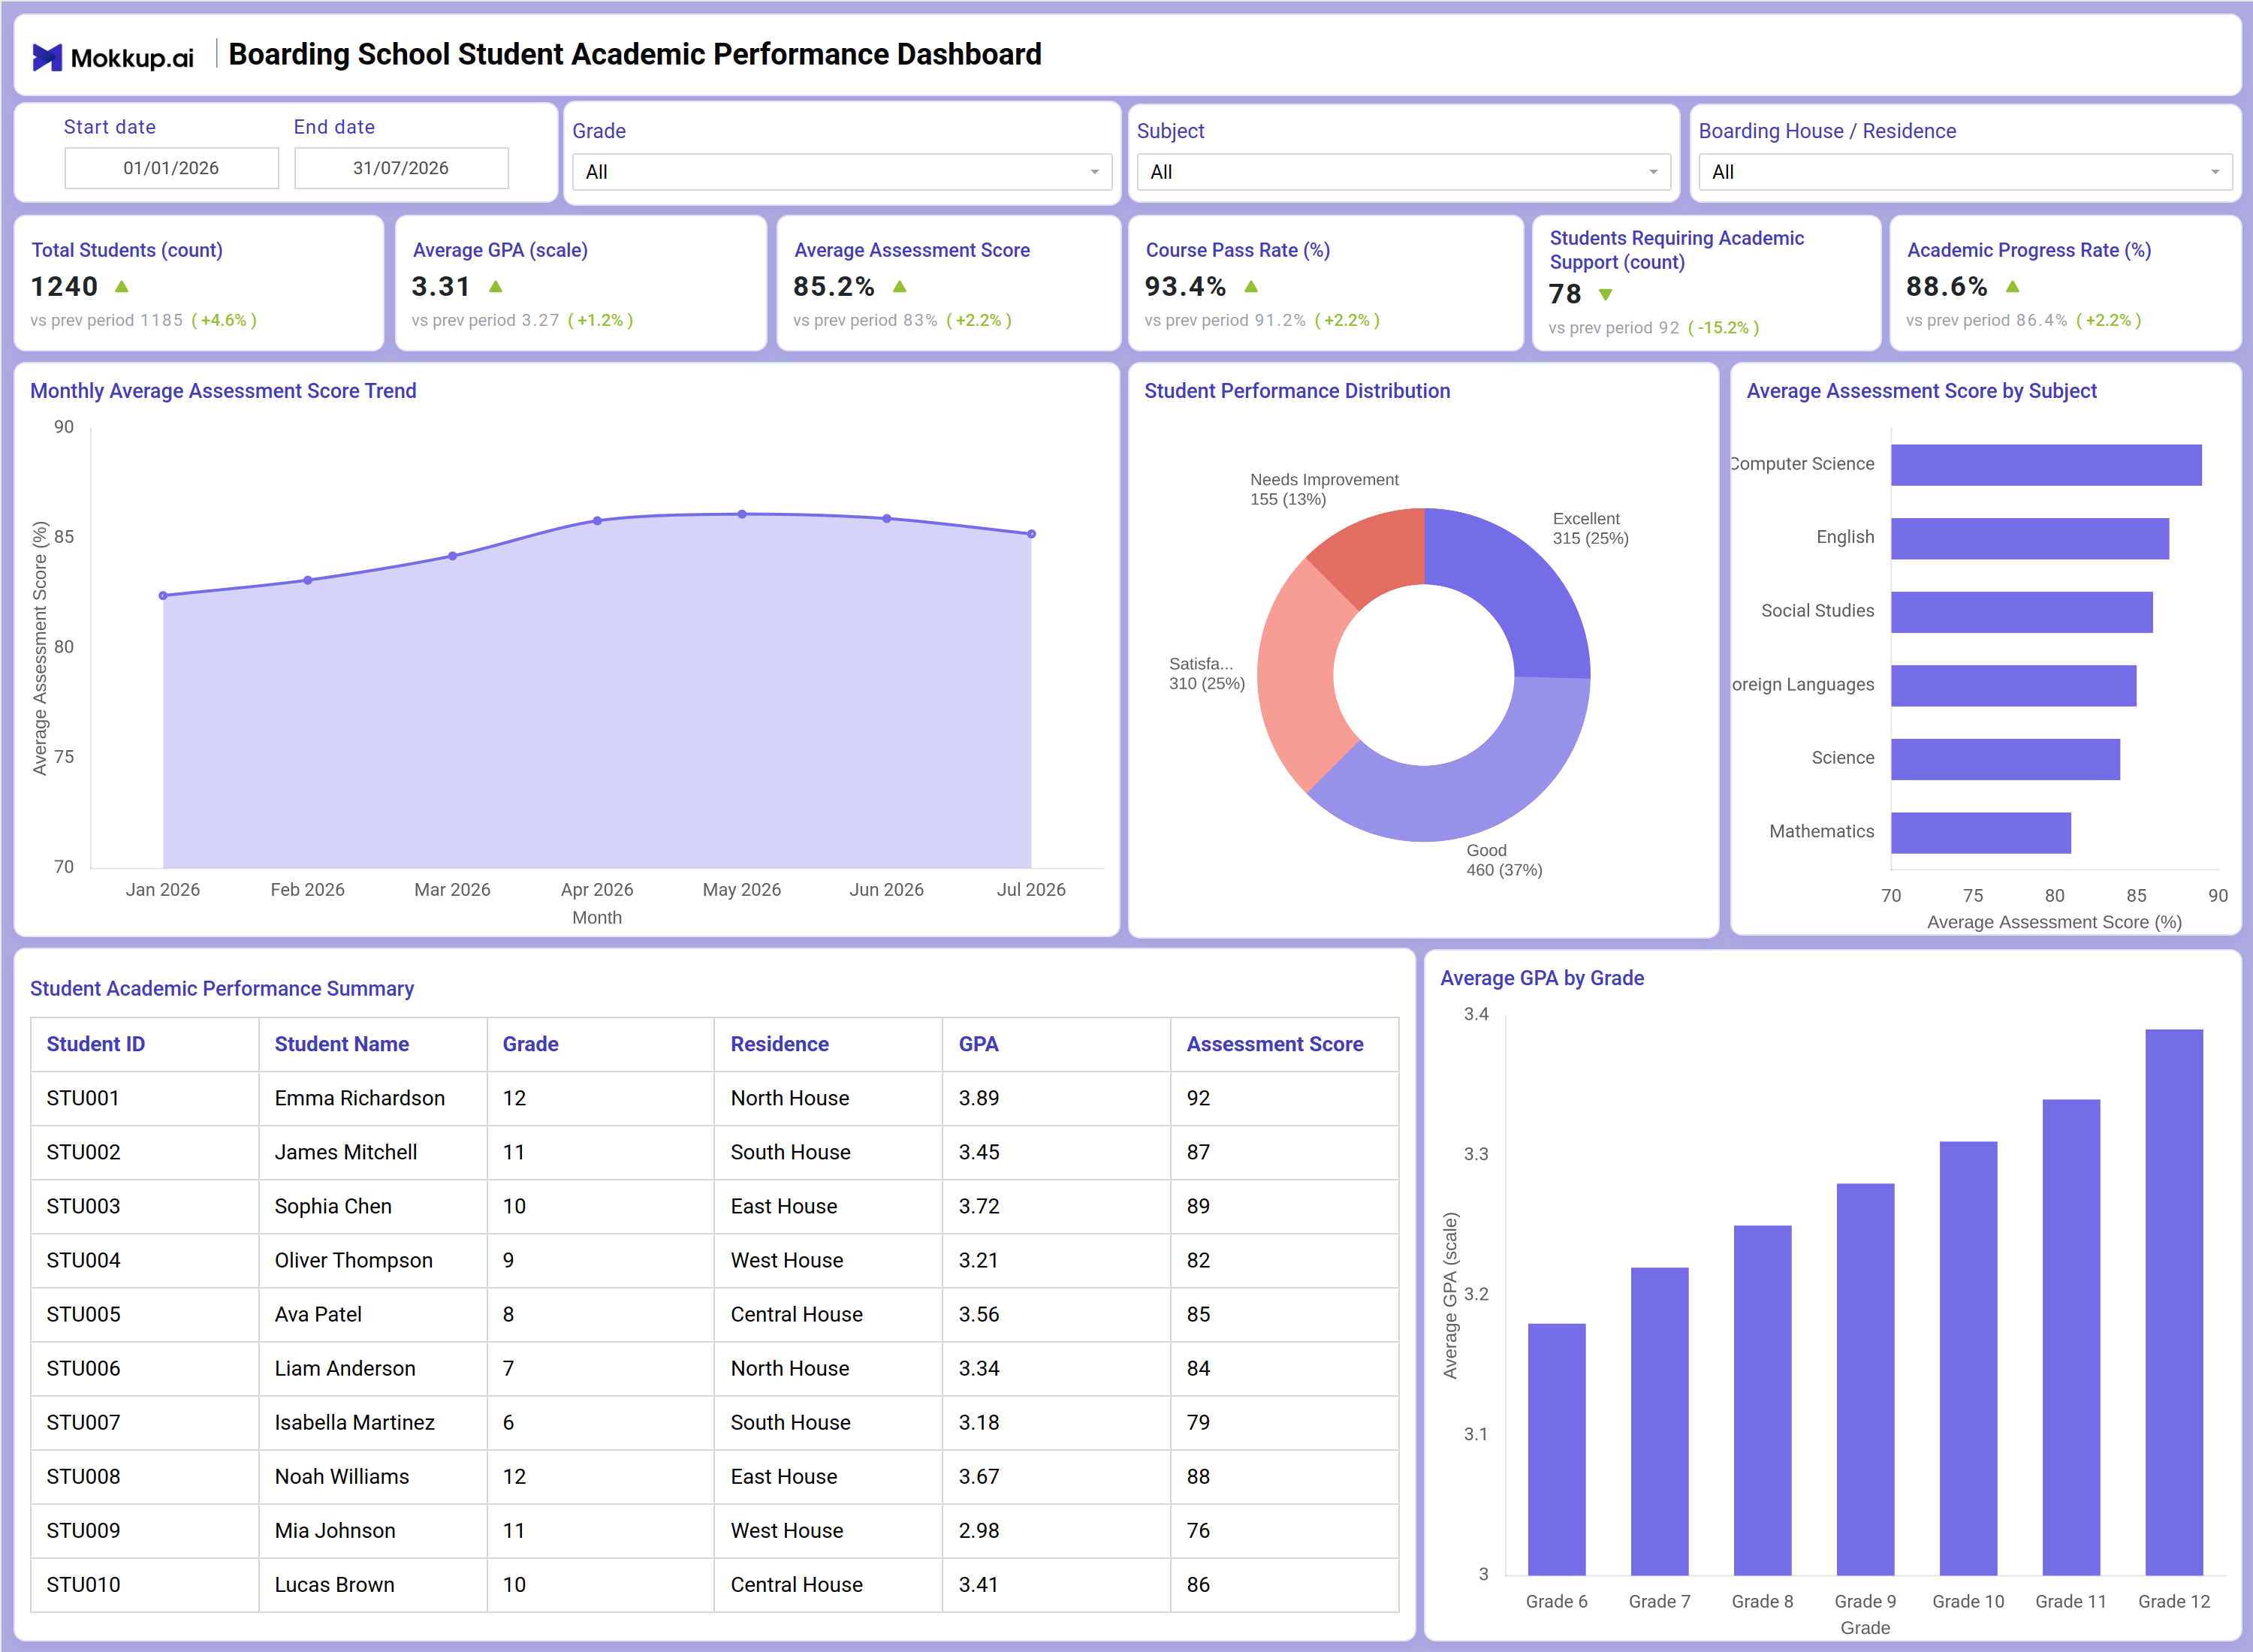
The Boarding School Student Academic Performance Dashboard is a reporting template built for academic coordinators, house parents, and school leadership teams who need a consolidated view of student outcomes across a boarding school. It brings together enrollment counts, grade point averages, assessment scores, and intervention indicators in one workspace so administrators can monitor learning outcomes without pulling data from separate gradebooks and residence records. Filters for grade, subject, and boarding house or residence let staff narrow the view to a specific cohort, and an average GPA-by-grade dashboard template view lets academic teams compare progression across grade levels at a glance. Because boarding schools track students both in the classroom and in residence, this boarding school student academic performance dashboard links academic metrics with house-level context, giving pastoral and academic staff a shared reference point for student support conversations.
How to Create a Boarding School Student Academic Performance Dashboard
You don’t need to build your report from scratch—just start with a ready-to-use dashboard template from Mokkup. Add in your data and export it however you like. Here’s how to do it:
1. Create or Log in to Your Mokkup Account
Start by signing up on Mokkup.ai using your email. If you already have an account, just log in, and you'll be good to go.
2. Choose and Customize Your Dashboard Template
Find the Boarding School Student Academic Performance Dashboard template in the Templates section. Use the drag-and-drop editor to adjust KPIs, edit filters, or add elements based on your data.
3. Export to Your BI Tool
Once your dashboard wireframe is ready, use the BI Tool Export feature to send it directly to Power BI or Tableau for further analysis and enhancements. You can also download the dashboard as a PDF, PNG, or JPEG, embed it on a platform, or invite your team to collaborate.
Note: This is a Pro template. You'll need a Pro subscription on Mokkup to use and customize this dashboard wireframe. Upgrade anytime to unlock full access.
Boarding School Student Academic Performance Dashboard Example
An academic dean or house coordinator typically opens this dashboard at the start of a grading period to understand how the student body is performing ahead of parent conferences or board reviews. The immediate question is usually whether performance is trending in the right direction and whether any grade, subject, or residence group needs closer attention. Filtering by grade, subject, or boarding house lets the coordinator move from a school-wide view down to a single cohort without switching tools. From the trend view, academic teams use this average assessment score tracking dashboard to see whether scores are improving month over month and to flag periods where performance dips before report cards go out.
Reviewing the student performance distribution helps staff gauge how many students are excelling versus how many are falling into a needs-improvement band, which shapes where tutoring or mentoring resources get allocated. Comparing average assessment scores across subjects lets department heads see which subject areas are underperforming and prioritize curriculum support, while comparing GPA across grades helps leadership decide where mentoring programs should be expanded. The student-level table lets house parents look up an individual student's grade and residence to coordinate support between academic and boarding staff. Together, these views help boarding school leadership move from reactive grade reporting to proactive academic planning, allowing teams to identify students who need support early, allocate teaching resources where they matter most, and keep academic and residential staff aligned on student progress.
How to Analyze Data in a Boarding School Student Academic Performance Dashboard
Here is how you can analyze data from this dashboard:
- Use the Grade filter to isolate GPA and assessment trends for a specific grade level.
- Use the Subject filter to compare performance across Mathematics, Science, English, Social Studies, Foreign Languages, and Computer Science.
- Filter by Boarding House / Residence to review academic outcomes for a specific house group.
- Monitor the Monthly Average Assessment Score Trend to detect dips before they affect report cards.
- Review the Student Performance Distribution donut to see how many students fall into the Needs Improvement band.
- Use the Average Assessment Score by Subject bar chart to identify which subjects need curriculum support.
- Compare the Average GPA by Grade bar chart to find which grade levels need mentoring support.
- Track the Course Pass Rate KPI with this course pass rate monitoring tool to measure how many students meet minimum academic requirements.
Benefits of a Boarding School Student Academic Performance Dashboard
The following are the benefits of using this dashboard:
- Centralizes GPA, assessment scores, and pass rates for a boarding school in one structured template.
- Supports student performance distribution analysis across Excellent, Good, Satisfactory, and Needs Improvement bands.
- Reduces manual data compilation for academic reporting with pre-built KPI tiles and chart layouts.
- Functions as an average GPA by grade dashboard template that guides mentoring and resource decisions by grade level.
- Provides a subject-wise breakdown of assessment scores, reinforcing this average assessment score tracking dashboard for curriculum planning.
- Doubles as a course pass rate monitoring tool that helps academic and residence staff align on student support without rebuilding reports each term.
- Gives school leadership and house coordinators a shared view of academic progress through this academic progress rate tracking dashboard.
KPIs to Track in a Boarding School Student Academic Performance Dashboard
The following key KPIs can be tracked by using this dashboard:
- Total Students (count): Tracks total enrollment covered by the dashboard for the selected filters.
- Average GPA (scale): Measures overall academic standing across the student body.
- Average Assessment Score (%): Quantifies how students are performing on assessments across subjects.
- Course Pass Rate (%): Measures the share of students meeting minimum passing requirements.
- Students Requiring Academic Support (count): Flags students who need intervention before performance declines further.
- Academic Progress Rate (%): Anchors this academic progress rate tracking dashboard by measuring how much students are improving over time.
Frequently Asked Questions
1. What industries benefit most from this Boarding School Student Academic Performance Dashboard?
Boarding schools, international schools, and residential academic programs benefit most, especially academic deans, house coordinators, and school leadership teams. It also supports counselors tracking students who need academic support.
2. Can this dashboard track performance by boarding house or residence?
Yes. The Boarding House / Residence filter isolates GPA, assessment scores, and pass rates for a specific house group, and the Student Academic Performance Summary table lists each student's residence alongside their grade.
3. Is this dashboard suitable for tracking students who need academic support?
Yes. The Students Requiring Academic Support KPI and the Student Performance Distribution donut chart both feed into this student performance distribution analysis, helping teams prioritize intervention before it affects report cards.