
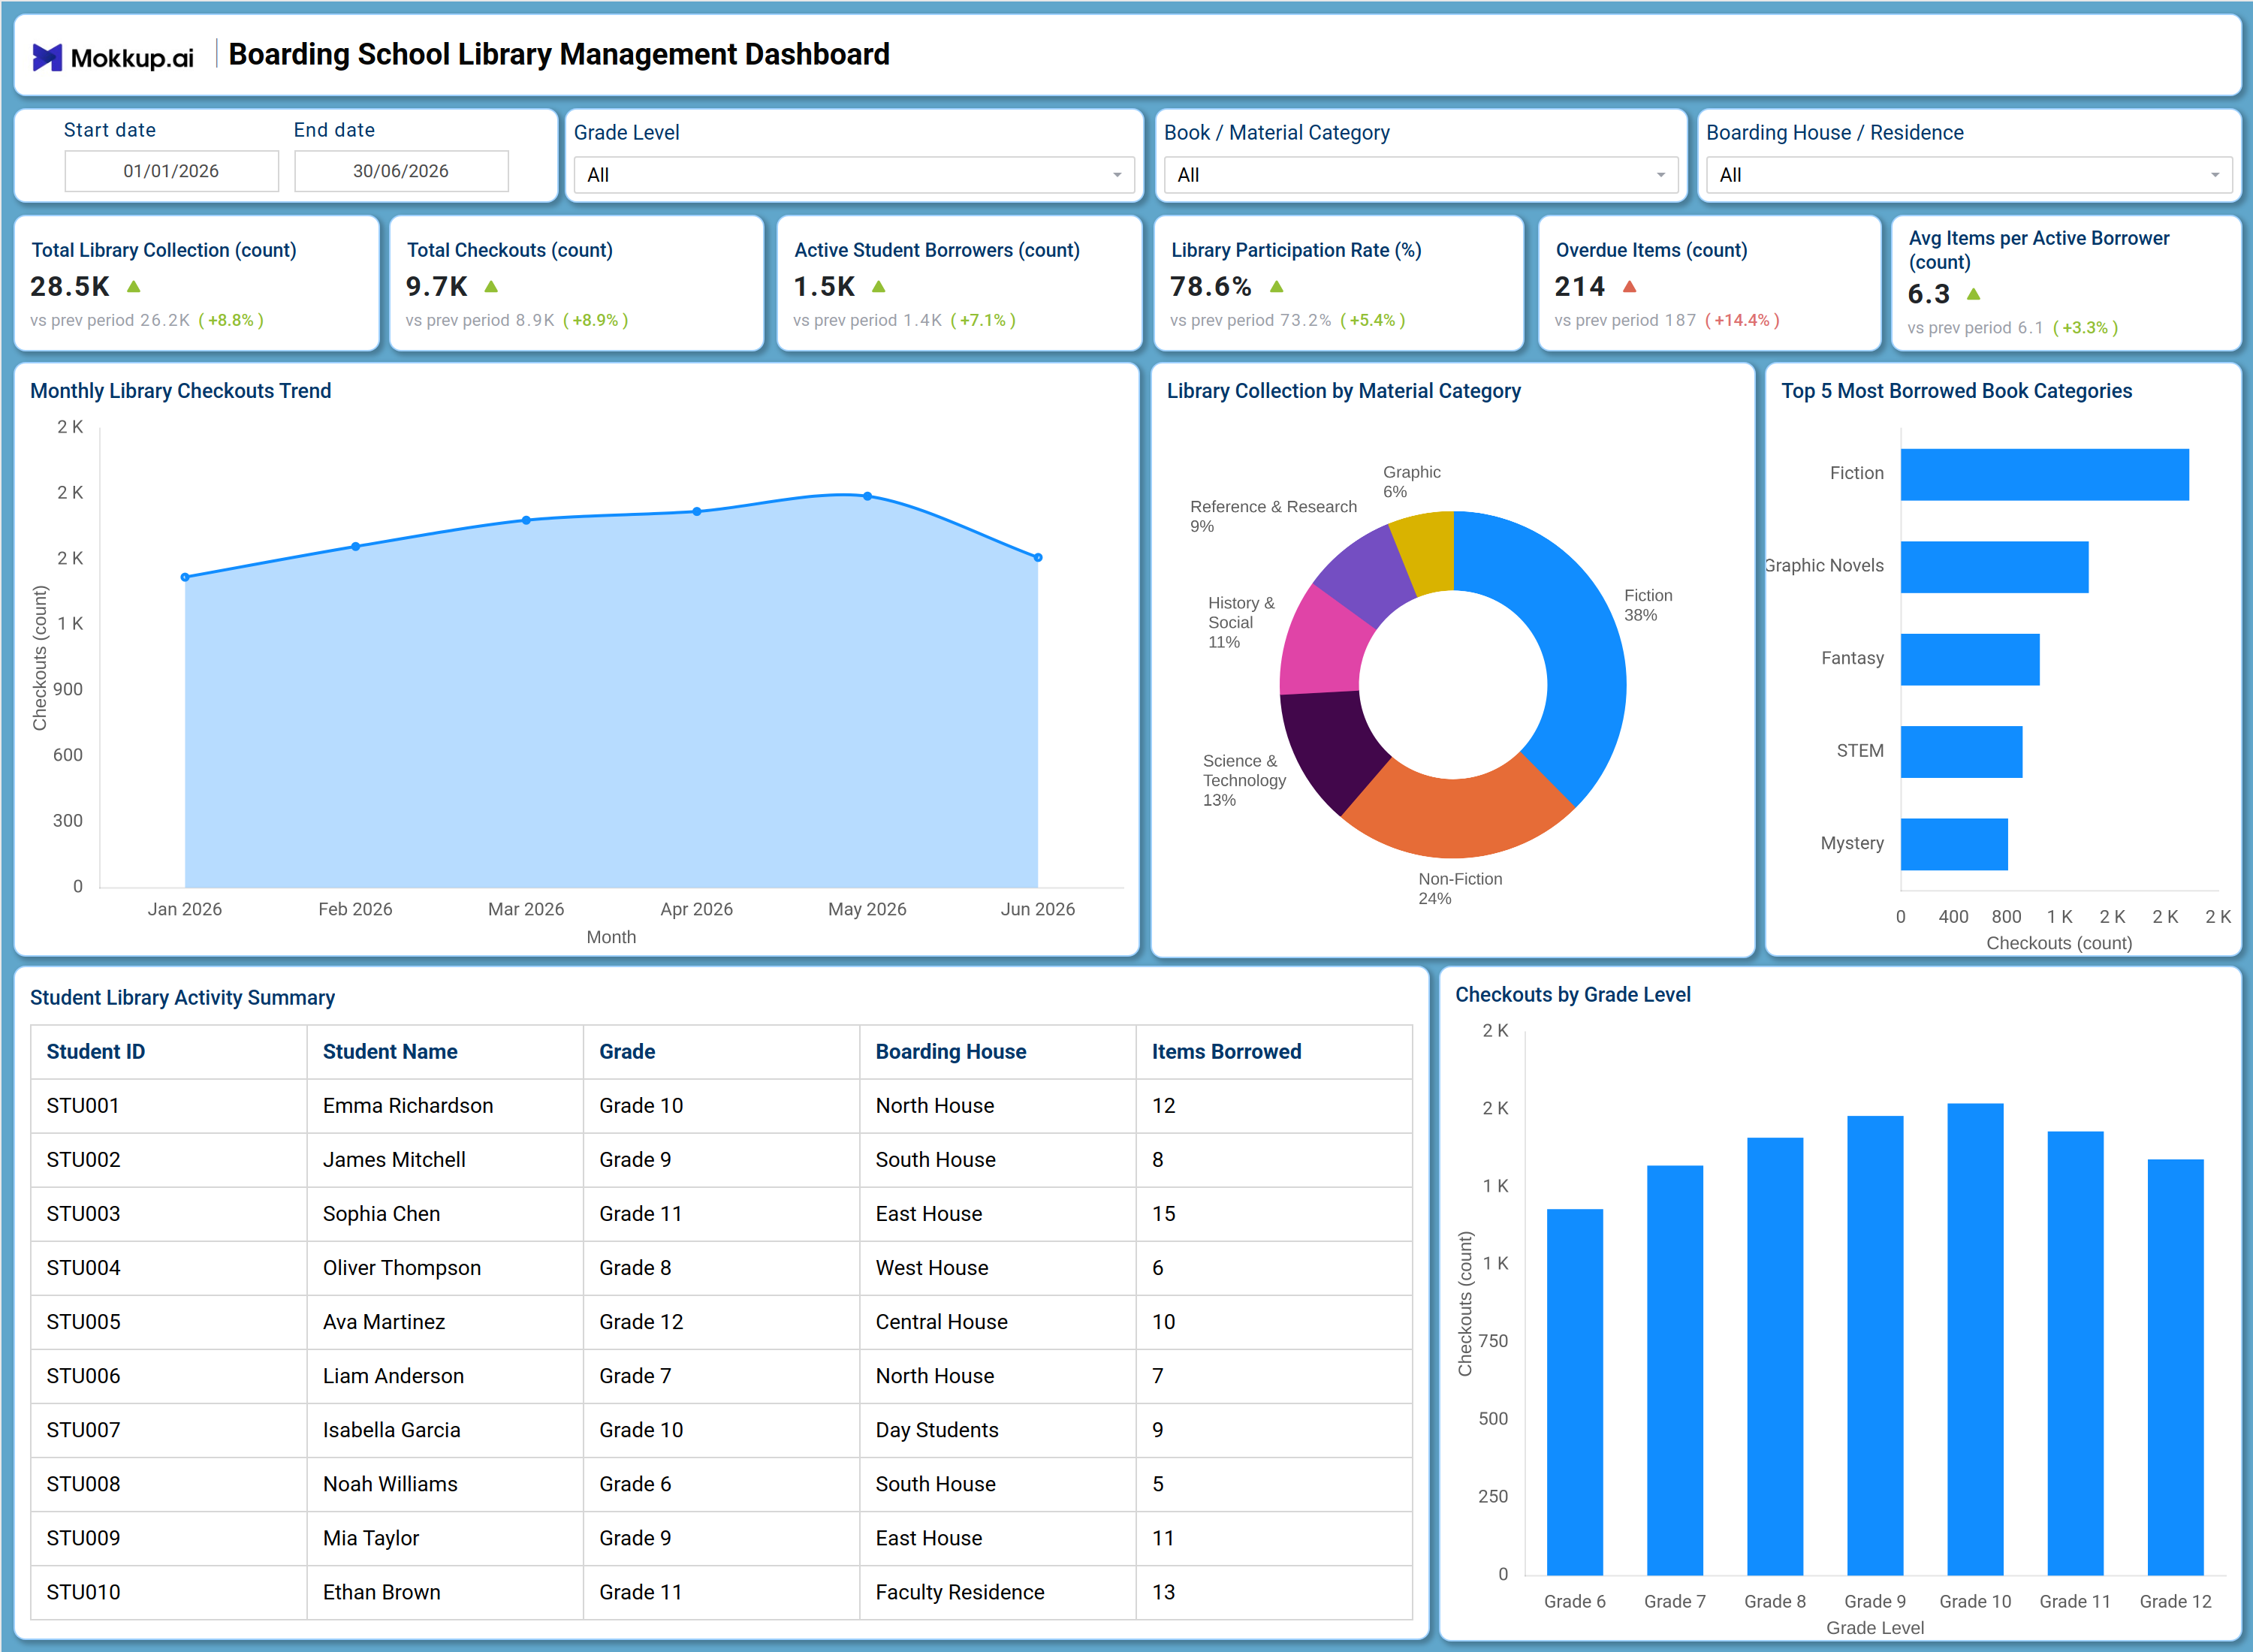
What is a Boarding School Library Management Dashboard
A boarding school library management dashboard gives librarians, boarding house supervisors, and school administrators a single consolidated view of how the library collection is being used across grade levels and residence houses. It brings together total collection size, checkout volumes, and active borrower counts so staff no longer need to pull figures from separate catalog systems or spreadsheets at the end of each term. Because boarding students live on campus and borrow throughout the week rather than only during school hours, this library collection by material category view helps staff understand demand patterns that day-school libraries rarely see. Built around Grade Level, Book / Material Category, and Boarding House / Residence filters, the dashboard adapts to any boarding school that wants to run library operations with more structure and less manual reporting.
How to Create a Boarding School Library Management Dashboard
You don't need to build your report from scratch; just start with a ready-to-use dashboard template from Mokkup. Add in your data and export it however you like. Here's how to do it:
1. Create or Log in to Your Mokkup Account
Start by signing up on Mokkup.ai using your email. If you already have an account, just log in, and you'll be good to go.
2. Choose and Customize Your Dashboard Template
Find the Boarding School Library Management Dashboard template in the Templates section. Use the drag-and-drop editor to adjust KPIs, edit filters, or add elements based on your data.
3. Export to Your BI Tool
Once your dashboard wireframe is ready, use the BI Tool Export feature to send it directly to Power BI or Tableau for further analysis and enhancements. You can also download the dashboard as a PDF, PNG, or JPEG, embed it on a platform, or invite your team to collaborate.
Note: This is a Pro template. You'll need a Pro subscription on Mokkup to use and customize this dashboard wireframe. Upgrade anytime to unlock full access.
Boarding School Library Management Dashboard Example
A school librarian typically opens this dashboard at the start of a term to understand how actively students across grades and boarding houses are engaging with the collection and whether current lending policies are holding up. Working within a set date range, the librarian narrows the view by grade, material category, or boarding house to answer a focused question, such as which residence is borrowing the least or which category of materials is falling out of favor with students. From this single screen, the librarian can follow library checkout trend-tracking dashboard patterns to see whether checkout volume is climbing ahead of exam periods or tapering off during long weekends and can compare checkout activity across grade levels to spot which cohorts are underusing the collection.
Reviewing the most borrowed categories helps the team decide where to expand the collection, while keeping an eye on overdue counts lets staff flag boarding houses or grades that need a reminder before backlogs grow. Because every boarding student lives on campus, this boarding house library activity tracking view gives residence supervisors a way to encourage reading engagement house by house rather than relying on generic school-wide reminders. Altogether, the dashboard helps library staff move from reactive record-keeping to a proactive approach where collection usage, checkout behavior, and overdue follow-up are reviewed together in one place. This gives school leadership more confidence that the library budget is being directed toward the categories students actually read and that no residence house is being left behind.
How to Analyze Data in a Boarding School Library Management Dashboard
Here is how you can analyze data from this dashboard:
- Filter by Grade Level: Compare library checkout activity across different grades.
- Filter by Boarding House / Residence: Identify which boarding houses contribute most to library participation.
- Filter by Book / Material Category: Focus on demand for Fiction, Non-Fiction, or Science & Technology titles.
- Set Start and End Dates: Compare library checkout trends across different terms or time periods.
- Monitor Monthly Library Checkouts: Identify declines in borrowing activity before overall participation drops further.
- Review Collection by Material Category: Identify sections that may be underrepresented in the current library collection.
- Analyze Top 5 Borrowed Categories: Determine which genres are most popular and may need additional copies.
- Compare Checkouts by Grade Level: Identify grades with borrowing activity below the school average.
- Search Student Library Activity: Look up a specific Student ID to review an individual's borrowing history.
Benefits of a Boarding School Library Management Dashboard
The following are the benefits of using this dashboard:
- Centralizes Library Data: Brings collection size, checkout volume, and borrower activity into one boarding school library management dashboard.
- Tracks Overdue Items: Flags rising overdue counts early to help prevent disruptions to student access.
- Supports Collection Planning: Provides a clear view of the library collection by material category to guide future acquisitions.
- Reduces Manual Reporting: Simplifies term-end circulation reporting with pre-built KPI tiles and charts.
- Tracks Boarding House Activity: Gives residence supervisors visibility into library participation across individual boarding houses.
- Reviews Individual Borrowing: Provides quick access to the Student Library Activity Summary for reviewing borrowing patterns.
- Guides Reordering Decisions: Uses checkout trends to identify popular categories and support data-driven collection reordering.
KPIs to Track in a Boarding School Library Management Dashboard
The following key KPIs can be tracked by using this dashboard:
- Total Library Collection (count): Tracks the total number of books and materials owned by the library, providing a baseline for collection size planning.
- Total Checkouts (count): Measures how many items were checked out within the selected period, reflecting overall circulation activity.
- Active Student Borrowers (count): Counts distinct students who checked out at least one item, indicating the breadth of library engagement.
- Library Participation Rate (%): Reflects the share of enrolled students actively borrowing, a key input for library participation rate monitoring across houses and grades.
- Overdue Items (count): Anchors this overdue items tracking dashboard by showing how many items are past their due date so staff can prioritize follow-up.
- Avg Items per Active Borrower (count): Measures how many items the average active borrower has checked out, signaling depth of engagement beyond simple headcounts.
Frequently Asked Questions
1. What schools benefit most from a boarding school library management dashboard?
Boarding schools with residential houses spanning multiple grade levels use this dashboard to track collection usage, checkout trends, and borrower activity. Librarians, boarding house supervisors, and school administrators all rely on it to plan acquisitions and monitor reading engagement across residences.
2. Can this dashboard track overdue items by boarding house?
Yes, this overdue items tracking dashboard can be filtered by Boarding House / Residence, so staff can see which houses are accumulating overdue items. This makes it easier to send targeted reminders before backlogs grow.
3. What does the Library Collection by Material Category chart show?
This donut chart breaks the total collection down by category, such as Fiction, Non-Fiction, Science & Technology, and Reference & Research, showing what share each category holds. It supports library collection by material category planning when deciding where to expand or trim the collection.
4. How does the Monthly Library Checkouts Trend chart work?
The area chart plots total checkouts by month across the selected date range, making it easy to spot seasonal peaks and dips. It is the core view behind library checkouts trend tracking dashboard analysis for term-over-term comparison.