
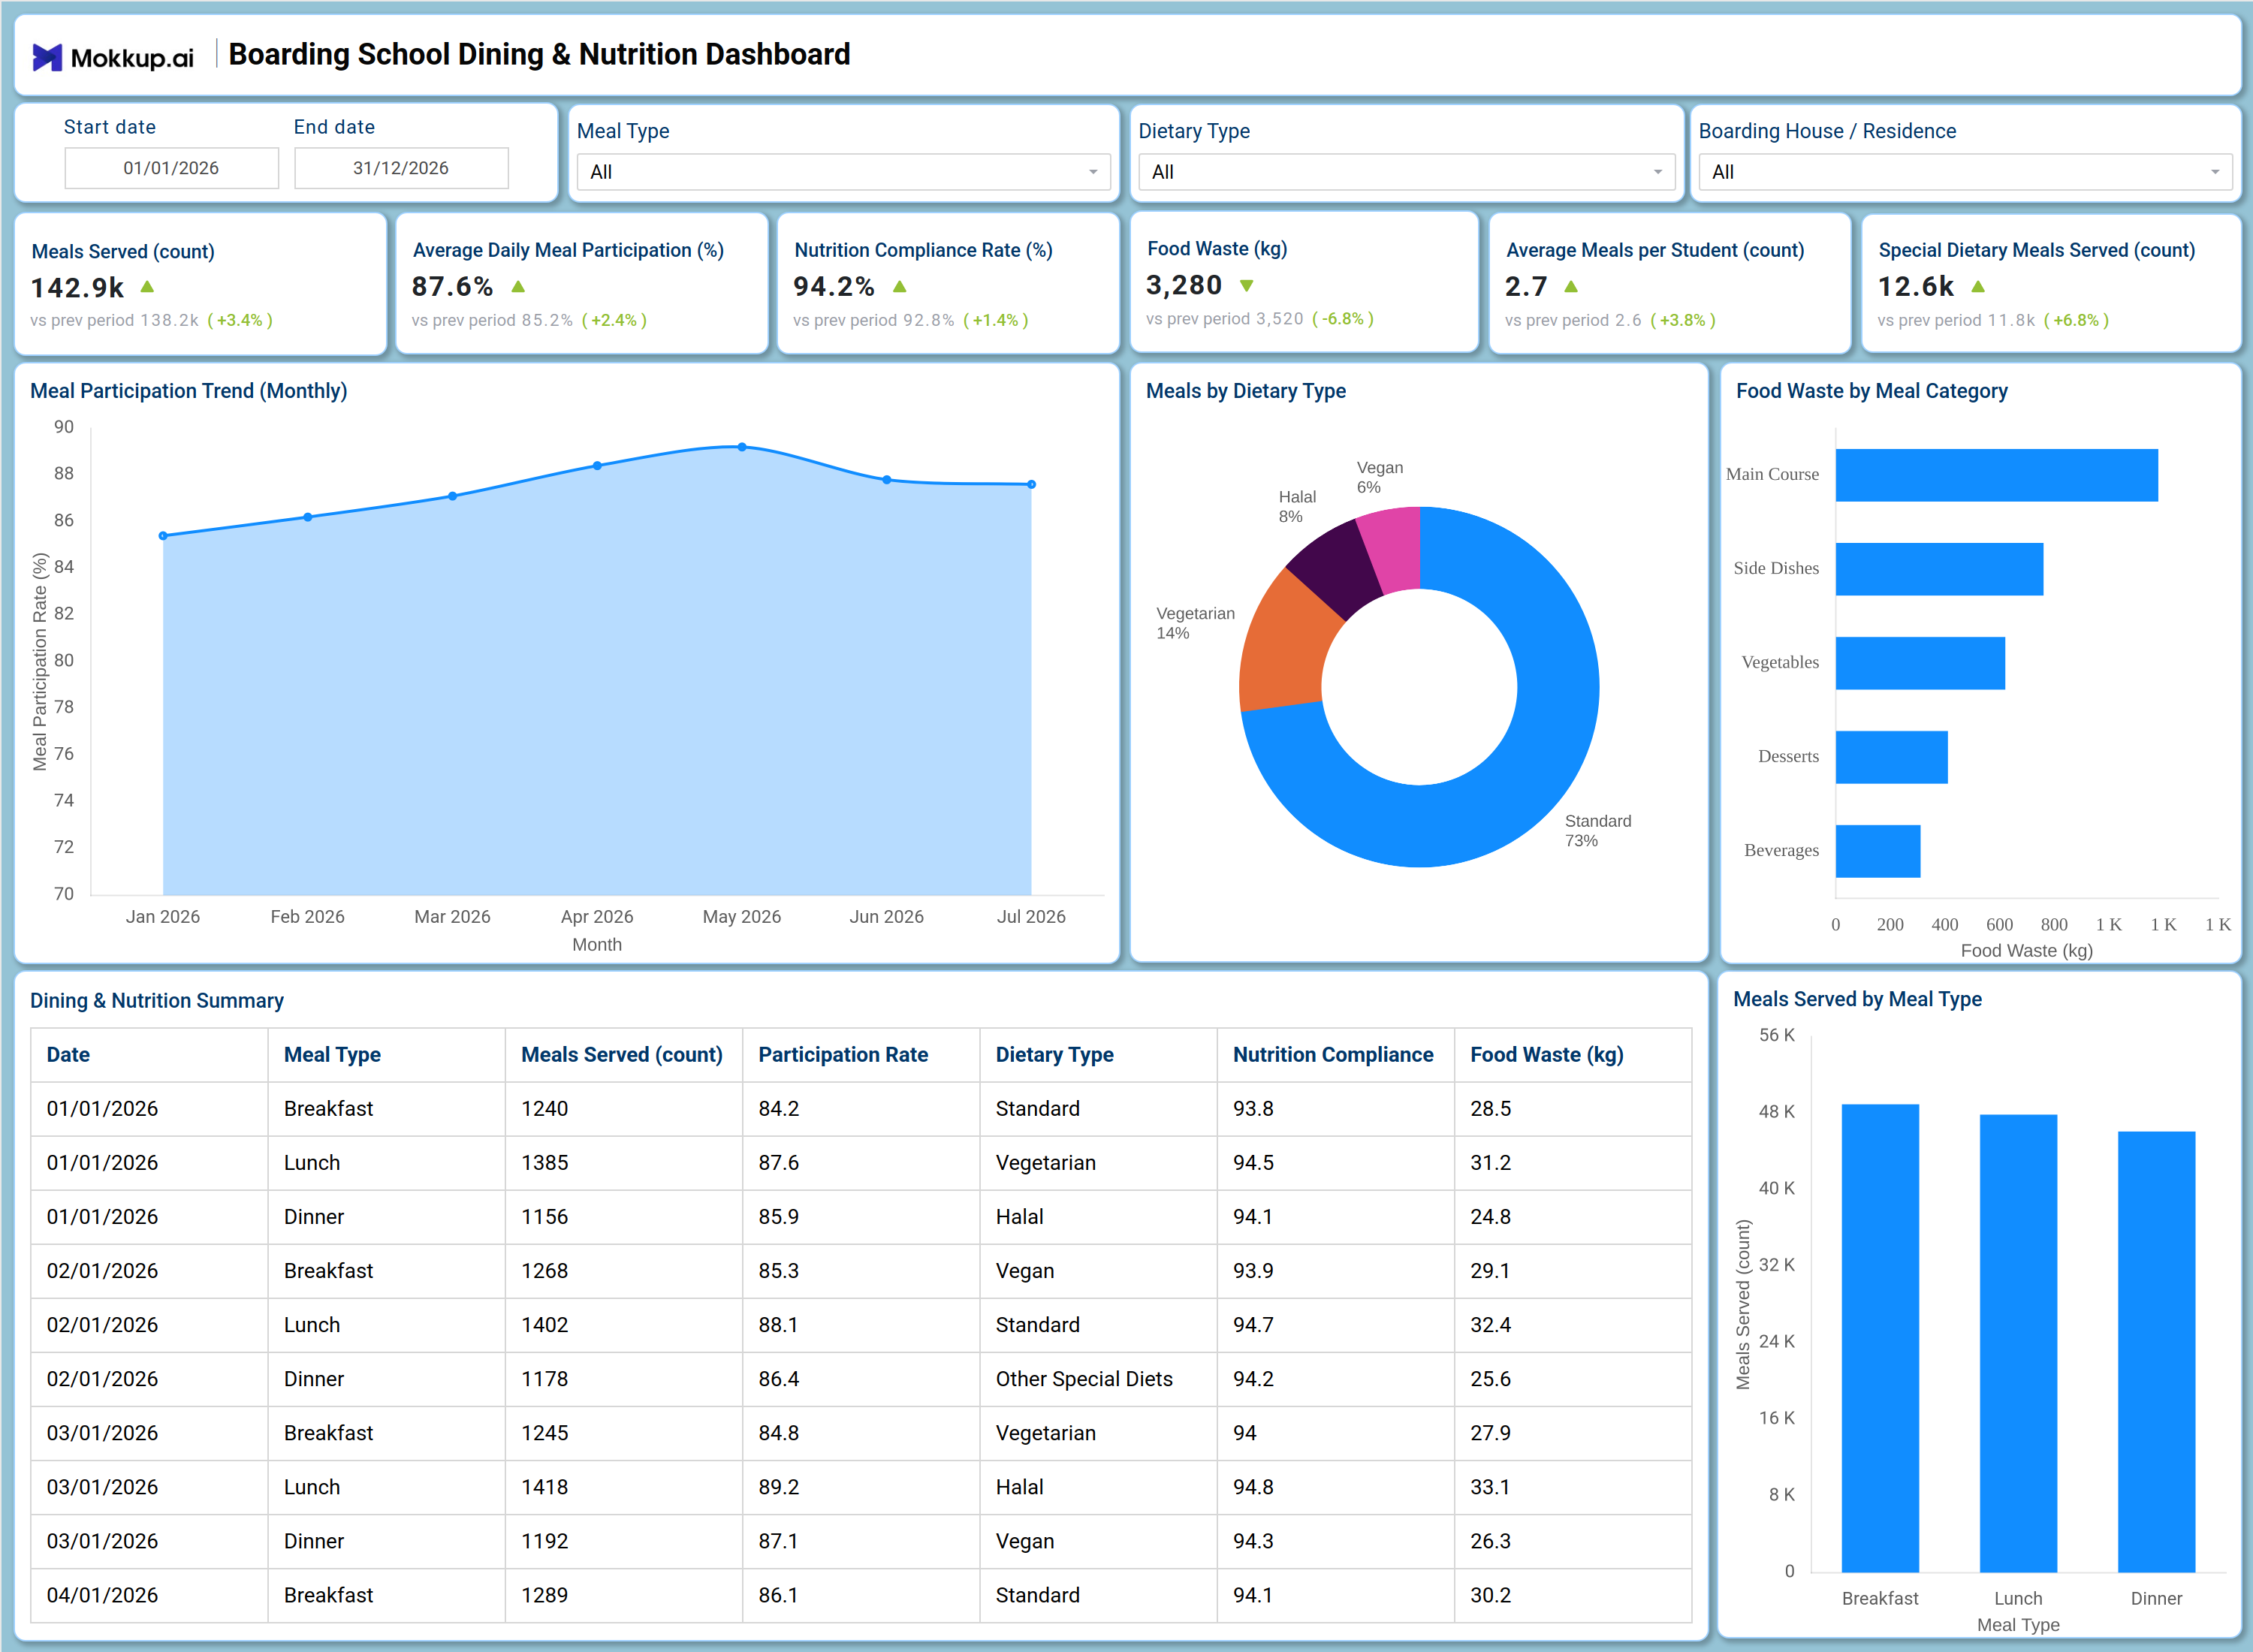
What is a Boarding School Dining & Nutrition Dashboard?
The Boarding School Dining & Nutrition Dashboard is a reporting template built for boarding school administrators, dining services managers, and wellness teams who need a single view of how meal programs are performing across residences. As a boarding school dining dashboard, it consolidates meals served, meal participation, nutrition compliance, food waste, and special dietary meal counts into one workspace, so operations staff no longer pull numbers from separate kitchen logs and survey sheets. Filters for meal type, dietary type, and boarding house or residence let teams narrow the view down to a specific dining hall or a specific date range without rebuilding any report. Because it also functions as a boarding school nutrition analytics tool, dietitians and program leads get the context they need to judge whether meal plans are meeting compliance targets and student demand across the term.
How to Create a Boarding School Dining & Nutrition Dashboard
You don't need to build your report from scratch; just start with a ready-to-use dashboard template from Mokkup. Add in your data and export it however you like. Here's how to do it:
1. Create or Log in to Your Mokkup Account
Start by signing up on Mokkup.ai using your email. If you already have an account, just log in, and you'll be good to go.
2. Choose and Customize Your Dashboard Template
Find the Boarding School Dining & Nutrition Dashboard template in the Templates section. Use the drag-and-drop editor to adjust KPIs, edit filters, or add elements based on your data.
3. Export to Your BI Tool
Once your dashboard wireframe is ready, use the BI Tool Export feature to send it directly to Power BI or Tableau for further analysis and enhancements. You can also download the dashboard as a PDF, PNG, or JPEG, embed it on a platform, or invite your team to collaborate.
Note: This is a Pro template. You'll need a Pro subscription on Mokkup to use and customize this dashboard wireframe. Upgrade anytime to unlock full access.
Boarding School Dining & Nutrition Dashboard Example
A dining services director typically opens this dashboard at the start of a reporting week to understand how meal programs performed across all boarding houses. Before looking at any single number, they set the date range and use the Boarding House / Residence filter to check whether one residence is behaving differently from the rest, since that is usually the first sign of a kitchen-level issue worth investigating. From there, the Meal Participation Trend gives the director a sense of whether student turnout for meals is rising, falling, or holding steady across the term, supporting the kind of meal participation trend analysis that informs portion sizing and staffing decisions. Alongside that, the team relies on nutrition compliance rate tracking to confirm that meals continue to meet dietary standards even as the menu rotates, so any dip can be caught and corrected before it affects an entire term rather than a single week.
Dietary type and meal type breakdowns help the same team see how demand is spread across standard, vegetarian, halal, vegan, and other special diets, which shapes how much of each dish to prepare and how inventory gets ordered. Food waste by meal category adds another layer, letting kitchen managers identify which part of the meal, whether that is the main course, side dishes, or desserts, is generating the most waste so sourcing and prep plans can be adjusted.Taken together, the dashboard helps boarding school teams move from reactive kitchen management to informed planning, aligning meal production with actual student participation, protecting nutrition standards, and reducing avoidable food waste across the dining program.
How to Analyze Data in a Boarding School Dining & Nutrition Dashboard
Here is how you can analyze data from this dashboard:
- Use the Boarding House / Residence filter to compare meal performance across individual dorms or dining halls.
- Monitor the Meal Participation Trend chart to support meal participation trend analysis and catch declines in student turnout early.
- Review the Meals by Dietary Type donut chart to see how demand splits across standard, vegetarian, halal, and vegan meals.
- Use the Food Waste by Meal Category bar chart to identify which dish category drives the most waste.
- Compare Meals Served by Meal Type to see how breakfast, lunch, and dinner volumes differ across the term.
- Filter by Dietary Type to check nutrition compliance for a single diet category at a time.
- Track the Nutrition Compliance Rate KPI over time to confirm meals continue to meet dietary standards.
- Reference the Dining & Nutrition Summary table to audit day-level participation, compliance, and waste figures together.
Benefits of a Boarding School Dining & Nutrition Dashboard
The following are the benefits of using this dashboard:
- Centralizes meals served, participation, compliance, and waste metrics in one boarding school dining dashboard.
- Reduces manual reconciliation of kitchen logs through built-in meal participation trend analysis.
- Supports meal type and dietary type filtering without rebuilding reports for each boarding house.
- Functions as a food waste reduction dashboard by isolating which meal categories generate the most waste.
- Gives wellness staff and dining managers a shared view of nutrition compliance across residences.
- Enables comparison of special dietary meal volumes to plan ingredient sourcing more accurately.
- Provides a day-level summary table for audits and term-end reporting.
KPIs to Track in a Boarding School Dining & Nutrition Dashboard
The following key KPIs can be tracked by using this dashboard:
- Meals Served (count): Tracks total meals produced and served across the reporting period, the baseline figure for capacity planning.
- Average Daily Meal Participation (%): Measures the share of enrolled students eating on a given day, signaling engagement with the dining program.
- Nutrition Compliance Rate (%): Supports nutrition compliance rate tracking by quantifying how closely served meals align with defined dietary standards.
- Food Waste (kg): Measures the volume of food discarded, central to any food waste reduction dashboard used for cost control.
- Average Meals per Student (count): Evaluates how many meals each student consumes on average, useful for portion and staffing decisions.
- Special Dietary Meals Served (count): Supports special dietary meals tracking by showing volume served across vegetarian, vegan, and halal categories.
Frequently Asked Questions
1. What industries benefit most from this Boarding School Dining & Nutrition Dashboard?
Boarding schools, residential academies, and school dining service providers benefit most from this boarding school nutrition analytics tool, along with wellness teams overseeing meal compliance. It also supports facilities managing multiple boarding houses under one dining program.
2. Can this dashboard track food waste by meal category?
Yes, the Food Waste by Meal Category chart breaks waste down by main course, side dishes, vegetables, desserts, and beverages. This helps kitchen managers target the specific dish types generating the most waste.
3. Does the dashboard support tracking of special dietary meals?
Yes, special dietary meals tracking is built in through the Dietary Type filter and the Meals by Dietary Type chart, covering standard, vegetarian, halal, and vegan categories. The Special Dietary Meals Served KPI also shows overall volume served.