
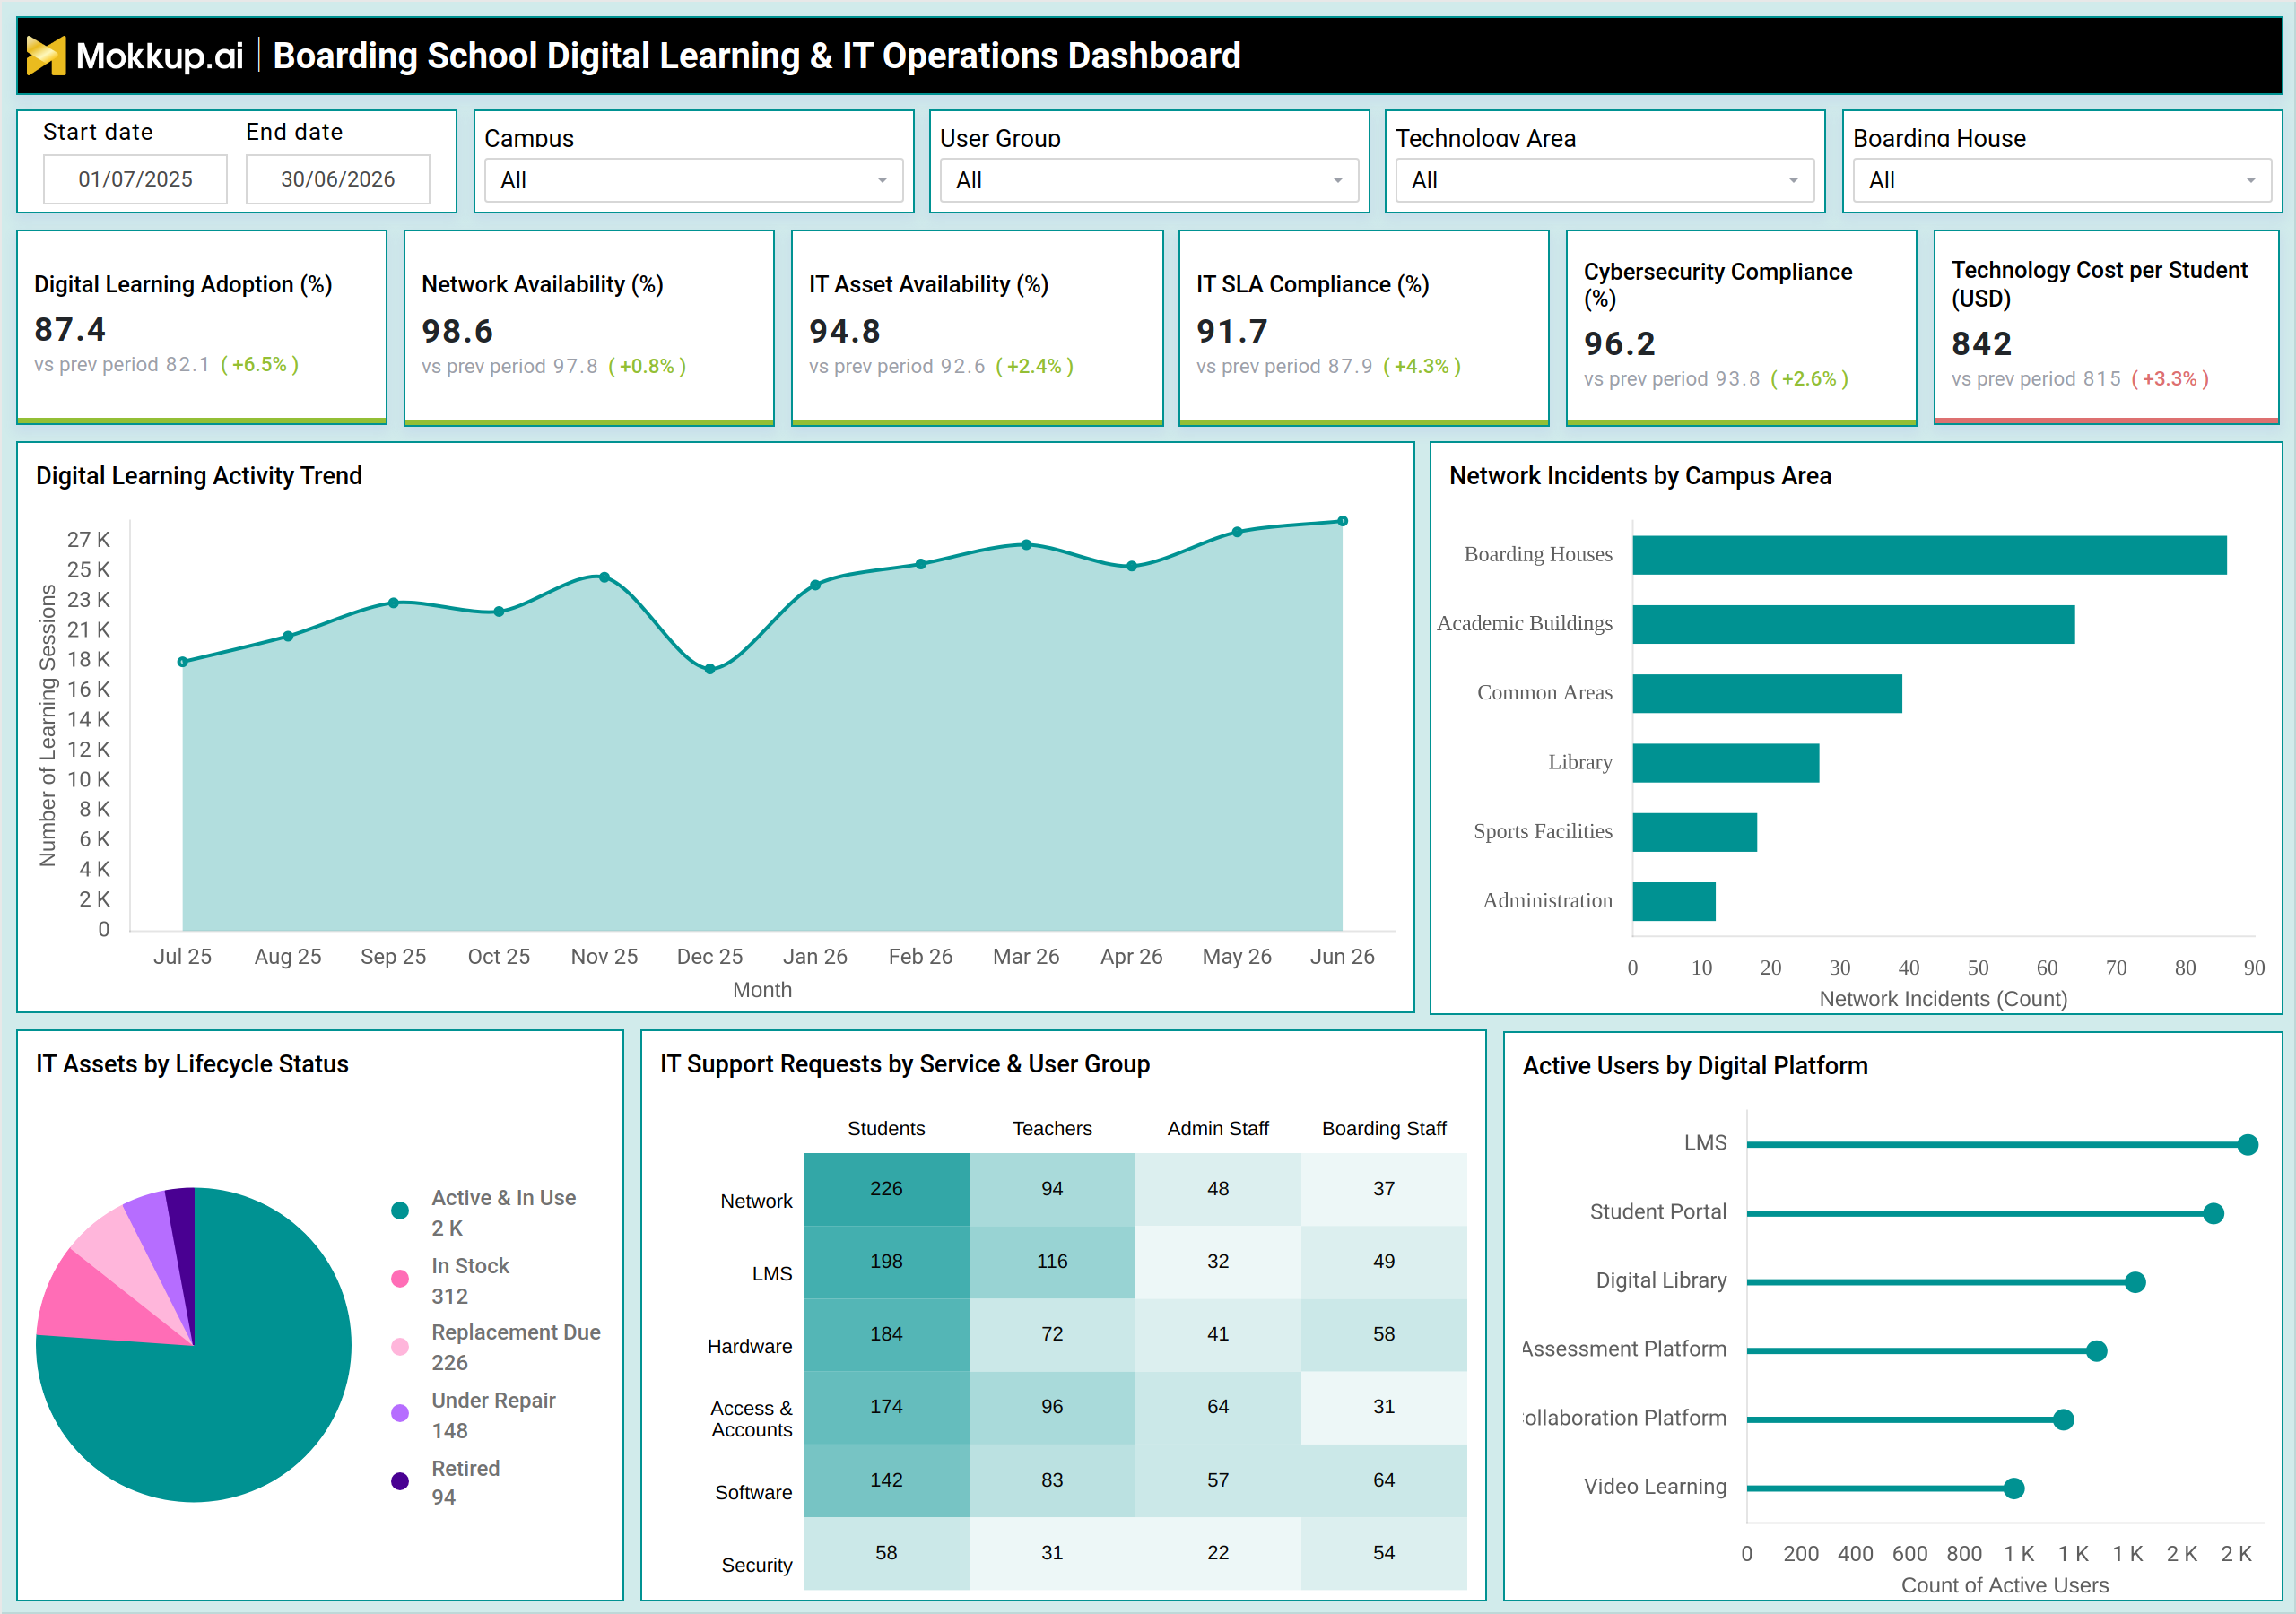
What is a Boarding School Digital Learning & IT Operations Dashboard
A boarding school digital learning dashboard gives IT administrators, academic technology coordinators, and campus leadership a single view of how digital learning tools and IT infrastructure perform across a residential campus. It brings together learning platform activity, network health, IT asset lifecycle tracking, support request volume, and cybersecurity compliance in one place, filterable by campus, user group, technology area, and boarding house. Instead of pulling separate reports from the learning management system, the IT service desk, and the network monitoring tool, teams get one connected view of how digital adoption relates to the infrastructure supporting it. Because boarding schools run around the clock across boarding houses, academic buildings, libraries, and common areas, IT teams need visibility into where incidents originate and how equipment moves through its lifecycle. This dashboard template gives schools that visibility without building a custom reporting system from scratch.
How to Create a Boarding School Digital Learning & IT Operations Dashboard
You don't need to build your report from scratch—just start with a ready-to-use dashboard template from Mokkup. Add in your data and export it however you like. Here's how to do it:
1. Create or Log in to Your Mokkup Account
Start by signing up on Mokkup.ai using your email. If you already have an account, just log in, and you'll be good to go.
2. Choose and Customize Your Dashboard Template
Find the Boarding School Digital Learning & IT Operations Dashboard template in the Templates section. Use the drag-and-drop editor to adjust KPIs, edit filters, or add elements based on your data.
3. Export to Your BI Tool
Once your dashboard wireframe is ready, use the BI Tool Export feature to send it directly to Power BI or Tableau for further analysis and enhancements. You can also download the dashboard as a PDF, PNG, or JPEG, embed it on a platform, or invite your team to collaborate.
Note: This is a Pro template. You'll need a Pro subscription on Mokkup to use and customize this dashboard wireframe. Upgrade anytime to unlock full access.
Boarding School Digital Learning & IT Operations Dashboard Example
A campus IT director opens this dashboard at the start of a review cycle to understand whether digital learning adoption is keeping pace with the technology investment being made across the school. Filtering by campus or boarding house lets the team narrow into a specific residential group before deciding whether a dip in activity is isolated or spread across the institution. The learning activity trend view helps the team judge whether adoption is tied to the academic calendar or declining in a way that needs attention from the academic technology team.
From there, the dashboard supports network incident monitoring for schools by letting teams compare incident volume across boarding houses, academic buildings, libraries, and shared spaces, so infrastructure investment can be prioritized where disruptions are most frequent. Reviewing IT support request analysis by service and user group helps the helpdesk see whether students, teachers, admin staff, or boarding staff are generating disproportionate demand for a particular service, so staffing and training can be adjusted before backlogs build up. Looking at how devices move from active use toward replacement or repair helps procurement plan refresh cycles ahead of failure instead of reacting to it, while comparing adoption across learning platforms shows planners which tools are actually being used day to day.
Together, these views help IT and academic leadership align technology spending with actual usage, strengthen cybersecurity compliance tracking in education before gaps turn into incidents, and keep the boarding school's digital learning environment dependable for students who live on campus full time.
How to Analyze Data in a Boarding School Digital Learning & IT Operations Dashboard
Here is how you can analyze data from this dashboard:
- Filter by Campus / Boarding House: Focus on technology performance for a specific campus or residential group.
- Compare Digital Learning Adoption: Track usage trends month over month to identify seasonal changes or declining engagement.
- Monitor Network Incidents: Identify campus areas experiencing the highest number of network disruptions.
- Analyze IT Support Requests: Review requests by service type and user group to identify demand spikes early.
- Track IT Asset Lifecycle: Identify equipment approaching replacement so upgrades can be planned before failures occur.
- Compare Network Availability vs. Incidents: Assess whether infrastructure stability is reflected in network availability and incident volumes.
- Compare Active Digital Users: Identify which digital platforms generate the highest levels of daily engagement.
- Monitor Cybersecurity Compliance: Track cybersecurity compliance alongside access and security-related support requests to identify potential gaps.
Benefits of a Boarding School Digital Learning & IT Operations Dashboard
The following are the benefits of using this dashboard:
- Centralizes Technology Data: Brings digital learning, network, and IT asset data into one boarding school digital learning dashboard.
- Reduces Manual Reporting: Cuts the time spent compiling reports from the LMS, helpdesk, and network systems.
- Supports Asset Lifecycle Planning: Tracks IT asset lifecycles so replacement budgets can be planned before equipment failures occur.
- Monitors Technology Costs: Tracks technology cost per student to ensure spending remains aligned with actual usage.
- Provides Localized IT Visibility: Gives boarding house and campus leaders a clear view of technology performance in their areas.
- Improves IT Response Times: Helps IT teams identify support demand by user group and respond more efficiently.
- Strengthens Security Monitoring: Provides consistent visibility into cybersecurity compliance metrics to support a stronger security posture.
KPIs to Track in a Boarding School Digital Learning & IT Operations Dashboard
The following key KPIs can be tracked by using this dashboard:
- Digital Learning Adoption (%): share of enrolled users actively engaging with digital learning tools
- Network Availability (%): percentage of time campus network infrastructure remains operational
- IT Asset Availability (%): proportion of IT assets that are active and ready for use
- IT SLA Compliance (%): percentage of IT service requests resolved within agreed service levels
- Cybersecurity Compliance (%): measures adherence to required cybersecurity compliance tracking in education standards
- Technology Cost per Student (USD): supports technology cost per student tracking to keep IT spending aligned with enrollment
Frequently Asked Questions
1. What does a boarding school digital learning dashboard track?
It tracks digital learning adoption, network performance, IT asset status, support request volume, and cybersecurity compliance across a boarding school campus. Filters by campus, user group, technology area, and boarding house let teams narrow the view to a specific segment.
2. How does the dashboard support cybersecurity compliance tracking in education?
It surfaces a dedicated compliance metric alongside network incidents and access-related support requests, so IT teams can spot gaps before they become security issues. This gives boarding schools an ongoing view of where policy adherence needs attention.
3. Can this dashboard help manage technology costs?
Yes, it supports technology cost per student tracking by pairing spending data with adoption and infrastructure metrics. This helps leadership confirm that technology investment is matching actual usage across the school.