
What is a Blood Safety & Compliance Dashboard?
A Blood Safety & Compliance Dashboard is a healthcare monitoring tool that tracks blood safety performance, compliance with standards, and adverse incidents. It integrates data from screening, storage, handling, and donor-recipient reactions into a single platform, enabling blood banks and healthcare facilities to ensure safety, minimize risks, and comply with regulations.
The blood safety and compliance dashboard template provides real-time insights into screening failures, audit scores, staff compliance, and incident trends. As a real-time blood safety monitoring dashboard, it helps organizations reduce discard rates, manage risks, and quickly identify critical safety gaps.
How To Create Blood Safety & Compliance Dashboard
You don’t need to build your report from scratch—just start with a ready-to-use sample blood safety & compliance dashboard template from Mokkup. Add in your data and export it however you like. Here’s how to do it:
1. Create or Log in to Your Mokkup Account
Start by signing up on Mokkup.ai using your email. If you already have an account, just log in, and you’ll be good to go.
2. Choose and Customize Your Dashboard Template
You can find the Blood Safety & Compliance Dashboard template in the Templates section. Use the drag-and-drop editor to adjust KPIs, edit filters, or add elements based on your data.
3. Export to Your BI Tool
Once your dashboard wireframe is ready, use the BI Tool Export feature to send it directly to Power BI or Tableau for further analysis and enhancements. You can also download the dashboard as a PDF, PNG, or JPEG, embed it on a platform, or invite your team to collaborate.
Note: This is a Pro template. You’ll need a Pro subscription on Mokkup to use and customize this dashboard wireframe. Upgrade anytime to unlock full access.
Blood Safety & Compliance Dashboard Example
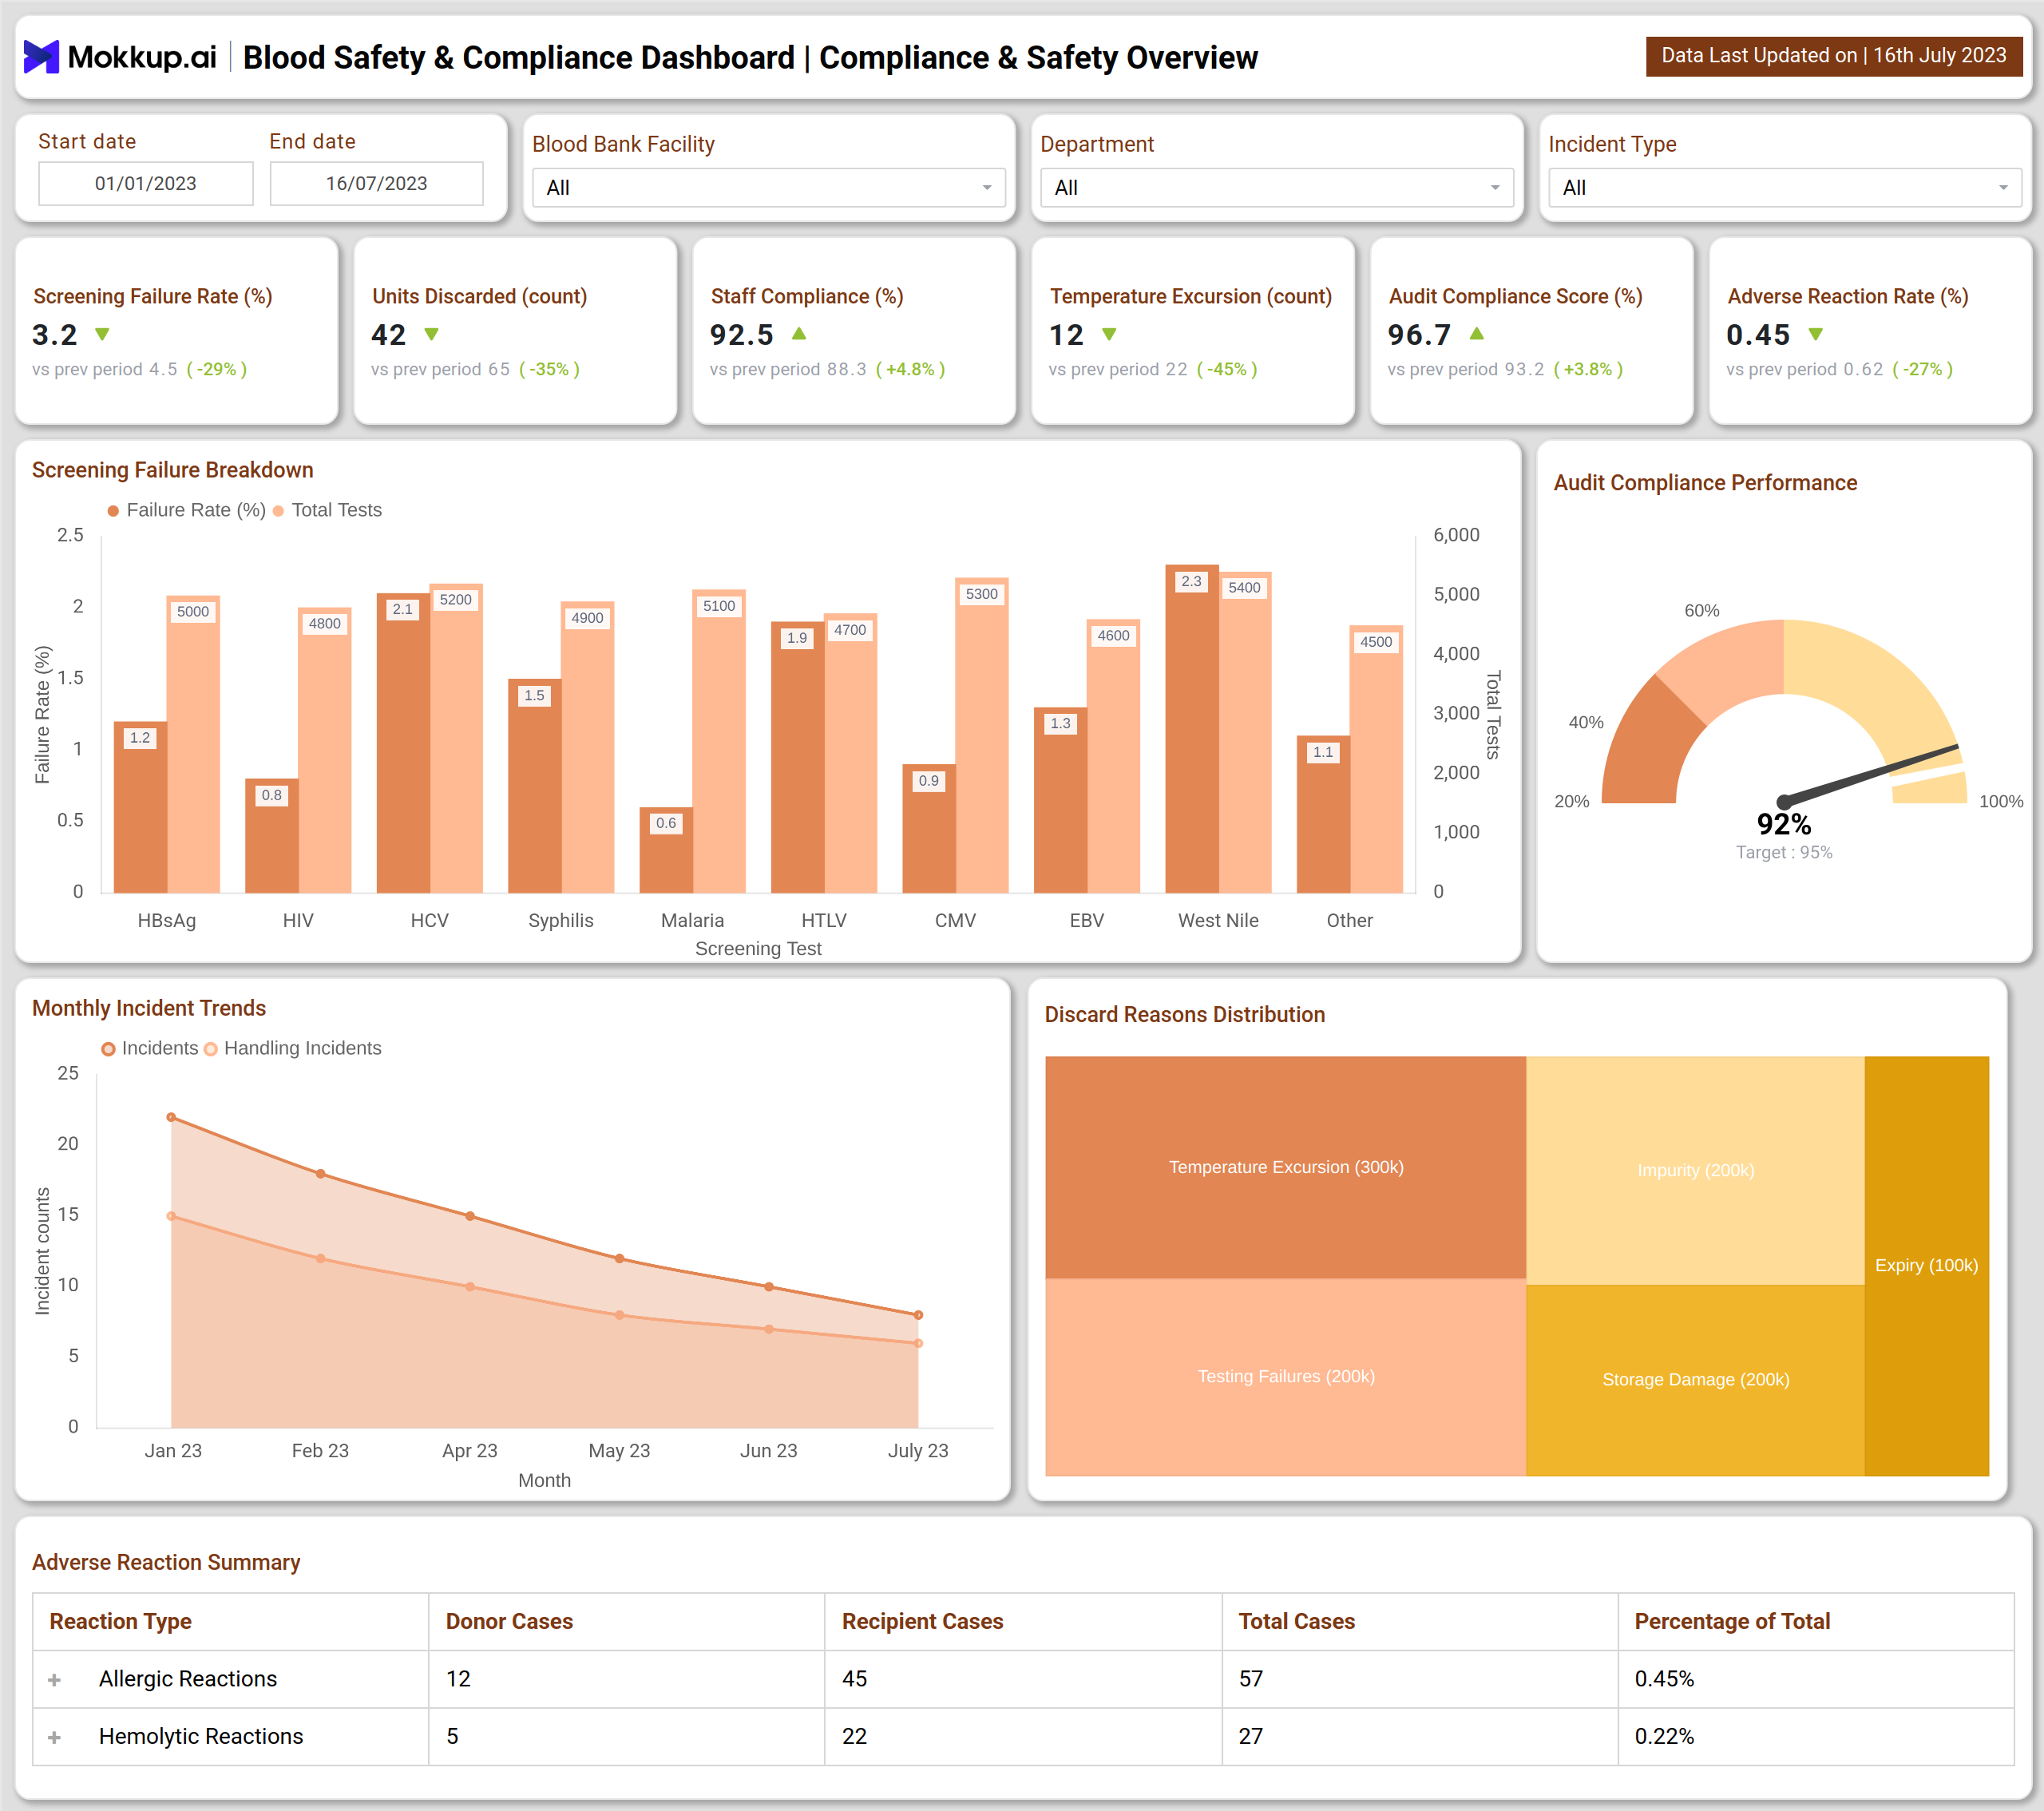
The example dashboard is divided into two views: Compliance & Safety Overview and Root Cause Analysis.
The Compliance & Safety Overview Dashboard monitors core safety metrics such as screening failure rates, units discarded, staff compliance, audit compliance scores, and adverse reaction rates. Visuals like screening failure breakdowns, incident trends, and discard reasons help blood banks analyze problem areas. Additional insights into patient and donor reactions highlight clinical risks and staff training needs.
The Root Cause Analysis Dashboard identifies why safety incidents occur and where improvements are needed. It tracks top causes of unit discard, corrective action progress, staff non-compliance, and high-risk incident counts. Heatmaps and incident logs detail non-compliance areas like collection, storage, and testing. Geographic mapping of temperature excursion hotspots further highlights operational vulnerabilities across facilities.
Together, these dashboards act as compliance and incident tracking dashboards, providing high-level monitoring and detailed drill-down analysis to strengthen blood safety management and heart vitality tracking.
How to Analyze Data in Blood Safety & Compliance Dashboards
Here are a few ways to analyze data from this dashboard:
- Monitor Screening Failures – Track failed test rates to prevent unsafe blood from entering the supply chain.
- Evaluate Audit and Staff Compliance – Measure how well staff adhere to safety protocols and regulatory standards.
- Analyze Discard Reasons – Identify common causes like expiry, contamination, or storage damage.
- Track Incident Trends – Use monthly breakdowns of adverse reactions or safety events for proactive risk management.
- Root Cause Investigation – Leverage non-compliance heatmaps and incident logs to pinpoint problem areas.
Benefits of Blood Safety & Compliance Dashboards
Here are the benefits of implementing this dashboard for root cause analysis in blood safety.
- Enhanced Patient and Donor Safety – Reduces risks by identifying safety gaps early.
- Regulatory Compliance – The blood safety & compliance dashboard template ensures adherence to standards.
- Proactive Risk Management – Real-time monitoring of incidents enables faster corrective actions.
- Operational Transparency – Incident logs and geographic trends provide clarity on issues across facilities.
- Improved Staff Accountability – Staff non-compliance metrics highlight training needs and performance issues.
KPIs to Track in Blood Safety & Compliance Dashboards
The key KPIs to track:
- Screening Failure Rate (%) – Measures the proportion of failed tests in overall screenings.
- Audit Compliance Score (%) – Reflects adherence to regulatory and quality standards.
- Adverse Reaction Rate (%) – Tracks donor and recipient reactions to transfusions.
- Units Discarded (count) – Monitors blood wastage due to safety or compliance issues.
- Staff Compliance (%) – Evaluates how effectively staff follow blood safety protocols.
Frequently Asked Questions
1. Why is a Blood Safety & Compliance Dashboard important?
It ensures patient and donor safety by monitoring failures, incidents, and compliance, while helping facilities meet regulatory requirements.
2. Can historical data be analyzed using this dashboard?
Yes, it allows trend analysis of blood usage, donor patterns, and safety incidents, helping in forecasting and strategic planning.
3. Is it suitable for both large and small healthcare facilities?
Yes, dashboards can be customized to fit different healthcare organizations' scale and specific requirements.