
What is a Biomass & Bioenergy Industrial Customer Service & Issue Resolution Dashboard?
A Biomass & Bioenergy Industrial Customer Service & Issue Resolution Dashboard is a data-driven platform designed to monitor, analyze, and optimize customer service operations in biomass power plants and bioenergy utilities. It aggregates service requests, complaint logs, and issue resolution data into a single interface, allowing operators to track performance metrics, identify recurring problems, and improve response efficiency. This dashboard helps biomass power plant operators, utility managers, and customer service teams assess service quality by measuring issue resolution speed, customer satisfaction, and revenue impacts from contract renewals. It also provides segmented insights based on customer type, issue severity, and regional performance, enabling targeted improvements in service delivery. By integrating service ticket data, SLA compliance metrics, and financial impacts, the dashboard ensures that customer service aligns with operational and business goals.
How to Create a Biomass & Bioenergy Industrial Customer Service & Issue Resolution Dashboard
You don't need to build your report from scratch, just start with a ready-to-use dashboard template from Mokkup. Add in your data and export it however you like. Here's how to do it:
1. Create or Log in to Your Mokkup Account
Start by signing up on Mokkup.ai using your email. If you already have an account, just log in, and you'll be good to go.
2. Choose and Customize Your Dashboard Template
Find the Biomass & Bioenergy Industrial Customer Service & Issue Resolution Dashboard template in the Templates section. Use the drag-and-drop editor to adjust KPIs, edit filters, or add elements based on your data.
3. Export to Your BI Tool
Once your dashboard wireframe is ready, use the BI Tool Export feature to send it directly to Power BI or Tableau for further analysis and enhancements. You can also download the dashboard as a PDF, PNG, or JPEG, embed it on a platform, or invite your team to collaborate.
Note: This is a Pro template. You'll need a Pro subscription on Mokkup to use and customize this dashboard wireframe. Upgrade anytime to unlock full access.
Biomass & Bioenergy Industrial Customer Service & Issue Resolution Dashboard Example
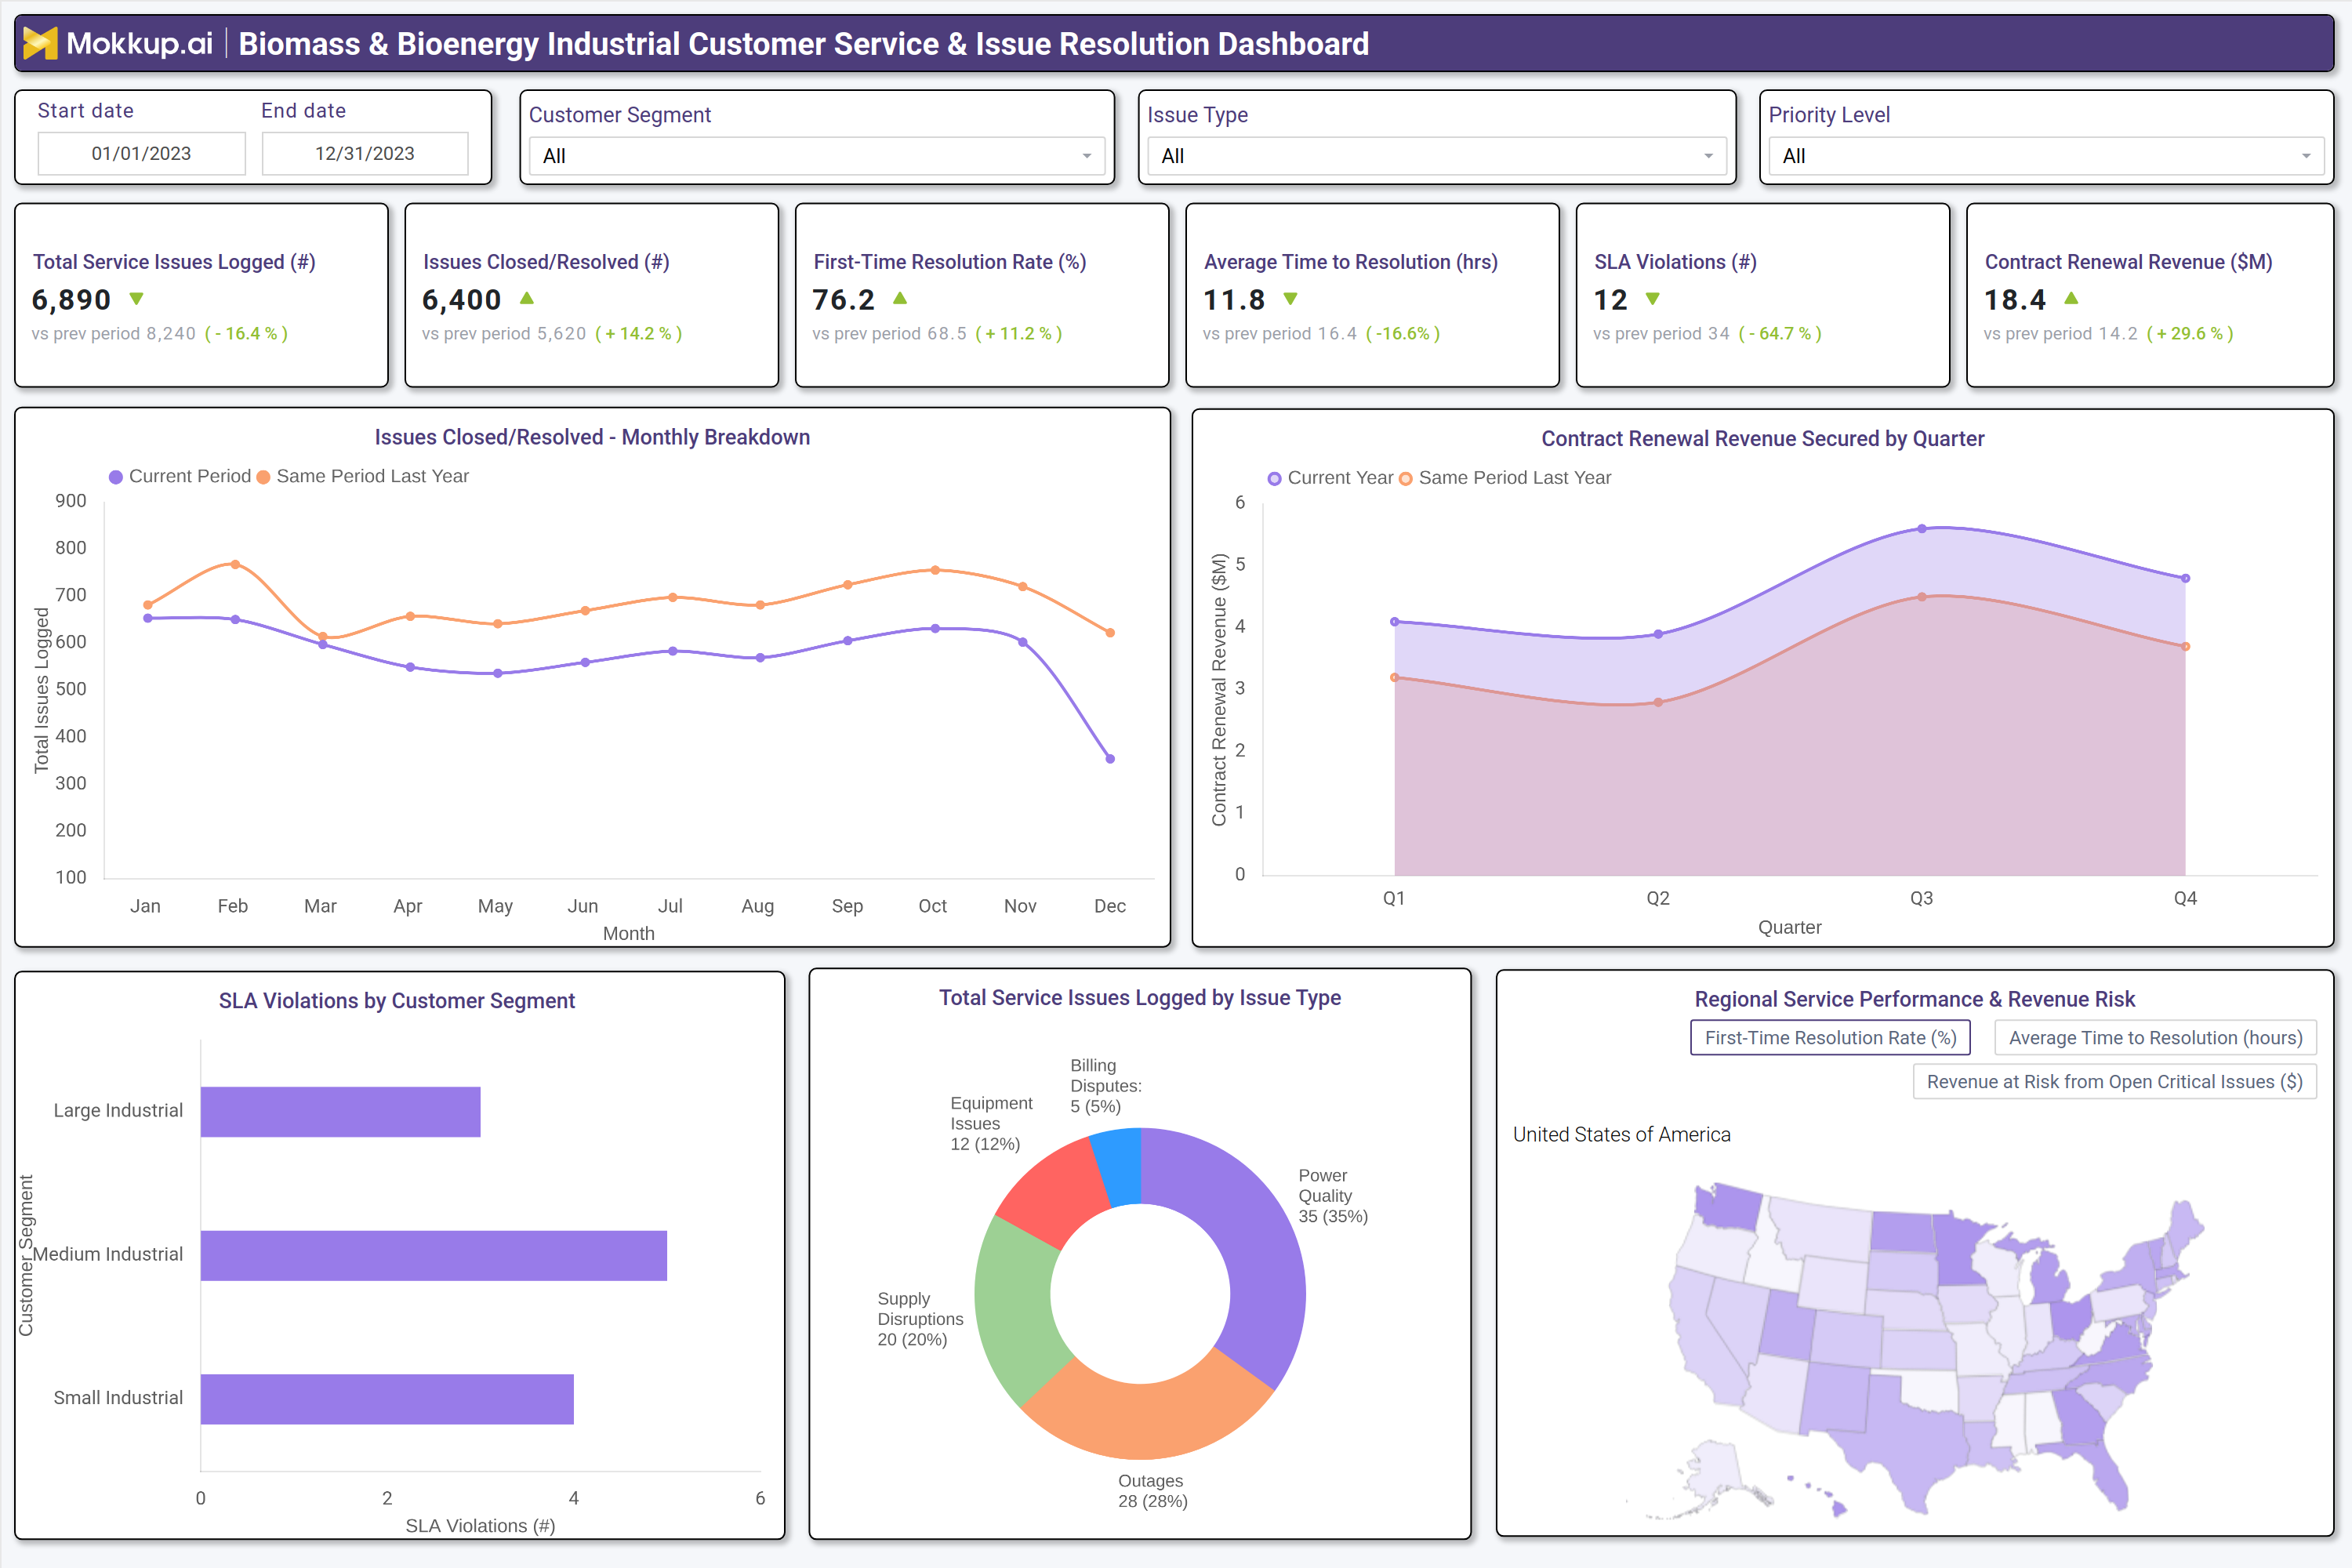
A typical biomass power plant customer service dashboard includes interactive filters for date range, customer segment, issue type, and priority level, allowing users to drill down into specific service trends. Key performance tiles display total service issues logged, issues resolved, first time resolution rate, average resolution time, SLA violations, and contract renewal revenue. Trend charts compare monthly issue resolution performance against previous periods, while a customer segment breakdown highlights SLA violations by industrial category (large, medium, small). A pie chart categorizes service issues by type, such as power quality, supply disruptions, equipment failures, and billing disputes, helping teams prioritize high-impact problems. A regional performance map visualizes first-time resolution rates and revenue at risk from open critical issues, enabling targeted interventions in underperforming areas.
Together, these components form a comprehensive bioenergy utility issue resolution software that provides actionable insights for improving customer service efficiency and operational reliability.
How to Analyze Data in a Biomass & Bioenergy Industrial Customer Service & Issue Resolution Dashboard
Here is how you can analyze data from this contract renewal revenue dashboard:
- Total Service Issues Logged – Review the total number of service issues reported to identify trends in customer complaints, recurring operational disruptions, and areas requiring improvement.
- Issues Resolved Monthly – Track the number of issues resolved each month to assess service team productivity, workload distribution, and overall operational efficiency.
- First-Time Resolution Rate – Monitor the percentage of issues resolved during the first interaction to evaluate support effectiveness and reduce escalations.
- Average Time to Resolution – Analyze the average time taken to resolve service issues to identify response delays, improve turnaround times, and enhance customer satisfaction.
- SLA Violations by Customer Segment – Identify service level agreement (SLA) breaches across different customer groups to prioritize high-value clients and mitigate potential revenue risks.
- Issue Type Analysis – Compare issues such as outages, equipment failures, billing disputes, and service requests to uncover recurring problems and implement targeted corrective actions.
- Regional Service Performance – Assess service quality across geographic regions to identify underperforming areas and allocate resources more effectively.
- Contract Renewal Revenue Trends – Evaluate renewal revenue patterns to understand how service quality impacts customer retention, loyalty, and long-term business growth.
Benefits of a Biomass & Bioenergy Industrial Customer Service & Issue Resolution Dashboard
The following are the benefits of using this first-time resolution rate dashboard:
- Enhanced Issue Resolution Efficiency – Track response times and resolution rates to improve service efficiency, reduce backlogs, and ensure timely issue resolution.
- Reduced SLA Violations – Monitor service level agreement (SLA) compliance proactively to identify potential breaches early and maintain high service standards.
- Improved Customer Satisfaction – Identify recurring service issues and address them promptly to enhance customer experience, build trust, and strengthen long-term relationships.
- Optimized Resource Allocation – Highlight high-priority customer segments and underperforming regions to allocate support resources more effectively and maximize operational efficiency.
- Increased Contract Renewal Revenue – Ensure service quality aligns with customer expectations to improve retention rates, strengthen loyalty, and drive contract renewals.
- Data-Driven Continuous Improvement – Provide actionable insights from service performance data to support ongoing enhancements in customer support processes and operational strategies.
- Streamlined Compliance Reporting – Maintain structured service logs and performance metrics to simplify compliance reporting, audits, and regulatory documentation.
- Predictive Issue Resolution – Analyze historical service request trends to anticipate potential issues, enable proactive support, and reduce the likelihood of recurring problems.
KPIs to Track in a Biomass & Bioenergy Industrial Customer Service & Issue Resolution Dashboard
The following key KPIs can be tracked by using this dashboard:
- Total Service Issues Logged (count): Measures the volume of customer complaints and service requests received.
- Issues Closed/Resolved (count): Tracks the number of service issues successfully resolved within a given period.
- First-Time Resolution Rate (%): Indicates the percentage of issues resolved on the first contact without escalation.
- Average Time to Resolution (hrs): Measures the average duration taken to resolve a service issue.
- SLA Violations (count): Counts the number of service level agreement breaches, indicating service delays.
- Contract Renewal Revenue ($M): Tracks revenue secured from customer contract renewals, reflecting service quality impact.
- Customer Satisfaction Score (CSAT) (%): Measures customer feedback on service quality and resolution effectiveness.
Frequently Asked Questions
1. What is a SLA violation tracking dashboard used for?
It monitors boiler safety, tracks field incidents, and ensures regulatory compliance in biomass power plants.
2. What data sources feed into this bioenergy issue resolution dashboard?
Boiler control systems, safety incident logs, maintenance records, regulatory compliance reports, and workforce safety databases.
3. Who should use a biomass customer service dashboard?
Plant managers, safety officers, compliance teams, and utility executives are responsible for boiler operations and workforce safety.