What is a Bioenergy REC Trading and Market Performance Dashboard?
A Bioenergy REC Trading and Market Performance Dashboard is an analytics platform designed to track Renewable Energy Certificate (REC) trading, pricing behavior, and monetization performance for biomass and bioenergy power producers. It acts as a bioenergy REC trading dashboard, enabling utilities to monitor tradable REC volumes, yield efficiency, price realization, trading margins, and exposure risks. The dashboard also functions as a renewable energy certificate trading dashboard, providing transparency into REC issuance, utilization, holding periods, and compliance execution. By combining market pricing trends with trading execution metrics, it delivers biomass REC market performance analytics that help utilities optimize REC monetization strategies, manage compliance risk, and improve market participation outcomes.
How to Create a Bioenergy REC Trading and Market Performance Dashboard
You don’t need to build your report from scratch, just start with a ready-to-use dashboard template from Mokkup. Add in your data and export it however you like. Here’s how to do it:
1. Create or Log in to Your Mokkup Account
Start by signing up on Mokkup.ai using your email. If you already have an account, just log in, and you’ll be good to go.
2. Choose and Customize Your Dashboard Template
Find the Bioenergy REC Trading and Market Performance Dashboard template in the Templates section. Use the drag-and-drop editor to adjust KPIs, edit filters, or add elements based on your data.
3. Export to Your BI Tool
Once your dashboard wireframe is ready, use the BI Tool Export feature to send it directly to Power BI or Tableau for further analysis and enhancements. You can also download the dashboard as a PDF, PNG, or JPEG, embed it on a platform, or invite your team to collaborate.
Note: This is a Pro template. You’ll need a Pro subscription on Mokkup to use and customize this dashboard wireframe. Upgrade anytime to unlock full access.
Bioenergy REC Trading and Market Performance Dashboard Example
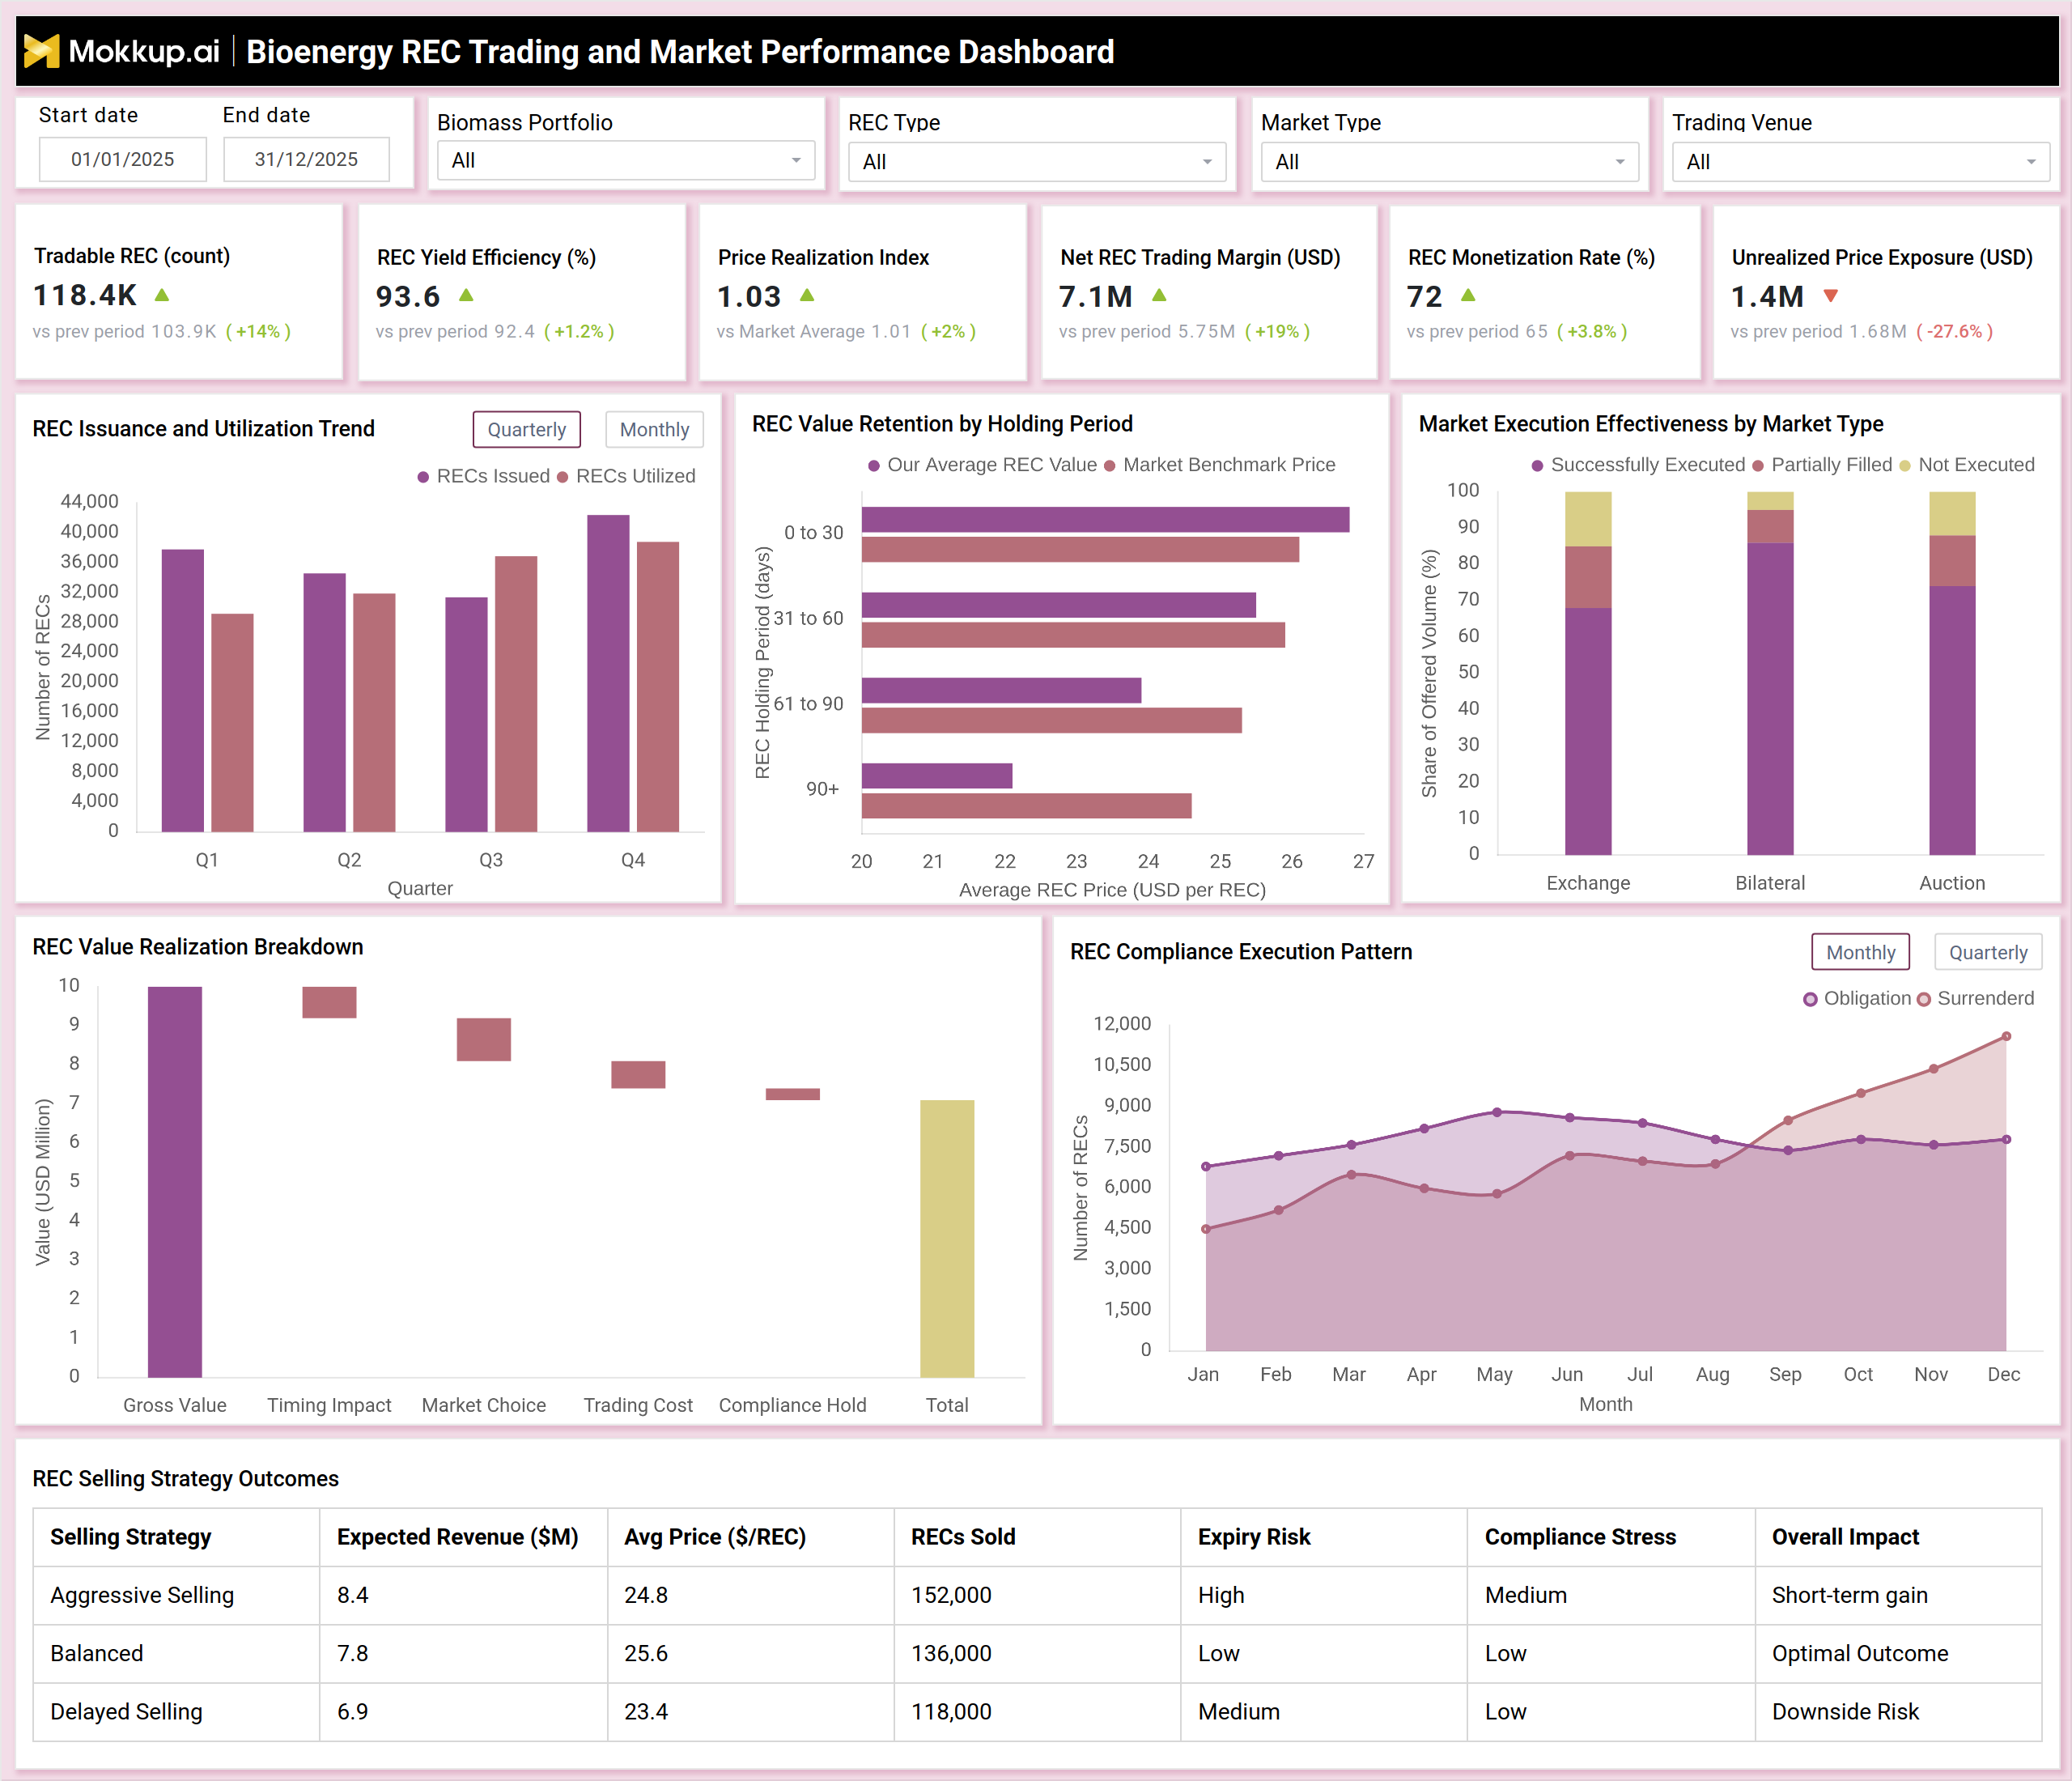
A typical dashboard begins with headline KPIs such as tradable REC count, REC yield efficiency, price realization index, net trading margin, monetization rate, and unrealized price exposure. These metrics provide a snapshot of overall REC portfolio performance. Trend charts show REC issuance versus utilization over time, helping users assess inventory buildup or drawdown. An REC value retention chart compares realized prices against market benchmarks across different holding periods. Market execution effectiveness visuals show how successfully RECs are executed across exchanges, bilateral deals, and auctions. Additional views break down value realization impacts from timing, market choice, trading costs, and compliance holding. A compliance execution trend tracks obligation versus surrender patterns, while a selling strategy table compares aggressive, balanced, and delayed approaches. Together, these visuals create a complete bioenergy REC price trend tracker and biomass power REC revenue analytics view.
How to Analyze Data in Bioenergy REC Trading and Market Performance Dashboard
Here is how you can analyze data from this dashboard:
- Start by reviewing the tradable REC count to understand available inventory.
- Analyze REC yield efficiency to assess certificate generation performance.
- Review the price realization index to compare achieved prices against market benchmarks.
- Track net REC trading margin to evaluate commercial performance.
- Monitor the REC monetization rate to understand how effectively inventory is converted to revenue.
- Analyze unrealized price exposure to assess market timing risk.
- Study REC issuance versus utilization trends to manage inventory balance.
- Review value retention by holding period to optimize selling timelines.
- Evaluate market execution effectiveness across exchanges, bilateral, and auction channels.
- Use value realization breakdowns to identify losses from timing or trading costs.
- Track compliance execution patterns to ensure obligation fulfillment.
- Compare selling strategy outcomes to select optimal REC trading approaches.
Benefits of Bioenergy REC Trading and Market Performance Dashboard
The following are the benefits of using this dashboard:
- Improves visibility into REC trading and monetization performance.
- Enables better price realization through data-driven selling strategies.
- Reduces compliance risk by tracking obligation and surrender patterns.
- Optimizes REC holding periods to maximize value retention.
- Identifies revenue leakage caused by timing or market selection.
- Strengthens trading execution across multiple market venues.
- Supports regulatory reporting and audit readiness.
- Enhances forecasting of REC revenue streams.
- Improves risk management related to price volatility.
- Drives higher profitability from biomass and bioenergy assets.
KPIs to Track in Bioenergy REC Trading and Market Performance Dashboard
The following key KPIs can be tracked by using this dashboard:
- Tradable REC (Count) – Total RECs available for trading.
- REC Yield Efficiency (%) – Certificate generation efficiency.
- Price Realization Index – Achieved price versus market average.
- Net REC Trading Margin (USD) – Profit from REC transactions.
- REC Monetization Rate (%) – Percentage of RECs sold or utilized.
- Unrealized Price Exposure (USD) – Market risk from unsold inventory.
- REC Issued vs. Utilized – Inventory movement over time.
- Average REC Holding Period – Duration before monetization.
- Market Execution Effectiveness (%) – Successful trade execution rate.
- Value Retention by Holding Period – Price preservation over time.
- Compliance Obligation vs. Surrender – Regulatory fulfillment tracking.
- Selling Strategy Impact – Revenue outcome by strategy type.
Frequently Asked Questions
1. Who should use this dashboard?
REC traders, compliance teams, commercial managers, and finance teams in bioenergy utilities.
2. Does it support multiple REC market venues?
Yes, it covers exchanges, bilateral contracts, and auction-based trading.
3. How does it help improve REC revenue?
By identifying optimal selling windows, market channels, and holding strategies.