What is a Cosmetology & Aesthetic Services Dashboard?
A Cosmetology & Aesthetic Services Dashboard is a data analytics tool that organizes, visualizes, and monitors all key metrics for beauty, skincare, and salon businesses. The dashboard consolidates financial, operational, and clinical performance data into interactive charts, giving clinic managers, owners, and practitioners real-time insight into the effectiveness of their services and operations. With modules covering procedure costs, service utilization, patient outcomes, and staff productivity, this dashboard streamlines reporting, enabling teams to make data-driven decisions that increase efficiency, profitability, and client satisfaction.
How to Create a Cosmetology & Aesthetic Services Dashboard
You don’t need to build your report from scratch—start with a ready-to-use dashboard template from Mokkup. Add your data and export it as needed. Here’s how to do it:
1. Create or Log in to Your Mokkup Account
Start by signing up on Mokkup.ai using your email. If you already have an account, log in, and you’ll be good to go.
2. Choose and Customize Your Dashboard Template
Find the Cosmetology & Aesthetic Services Dashboard template in the Templates section. Use the drag-and-drop editor to adjust KPIs, edit filters, or add elements based on your data.
3. Export to Your BI Tool
Once your dashboard wireframe is ready, use the BI Tool Export feature to send it directly to Power BI or Tableau for further analysis and enhancements. You can also download the dashboard as a PDF, PNG, or JPEG, embed it on a platform, or invite your team to collaborate.
Note: This is a Pro template. You’ll need a Pro subscription on Mokkup to use and customize this dashboard wireframe. Upgrade anytime to unlock full access.
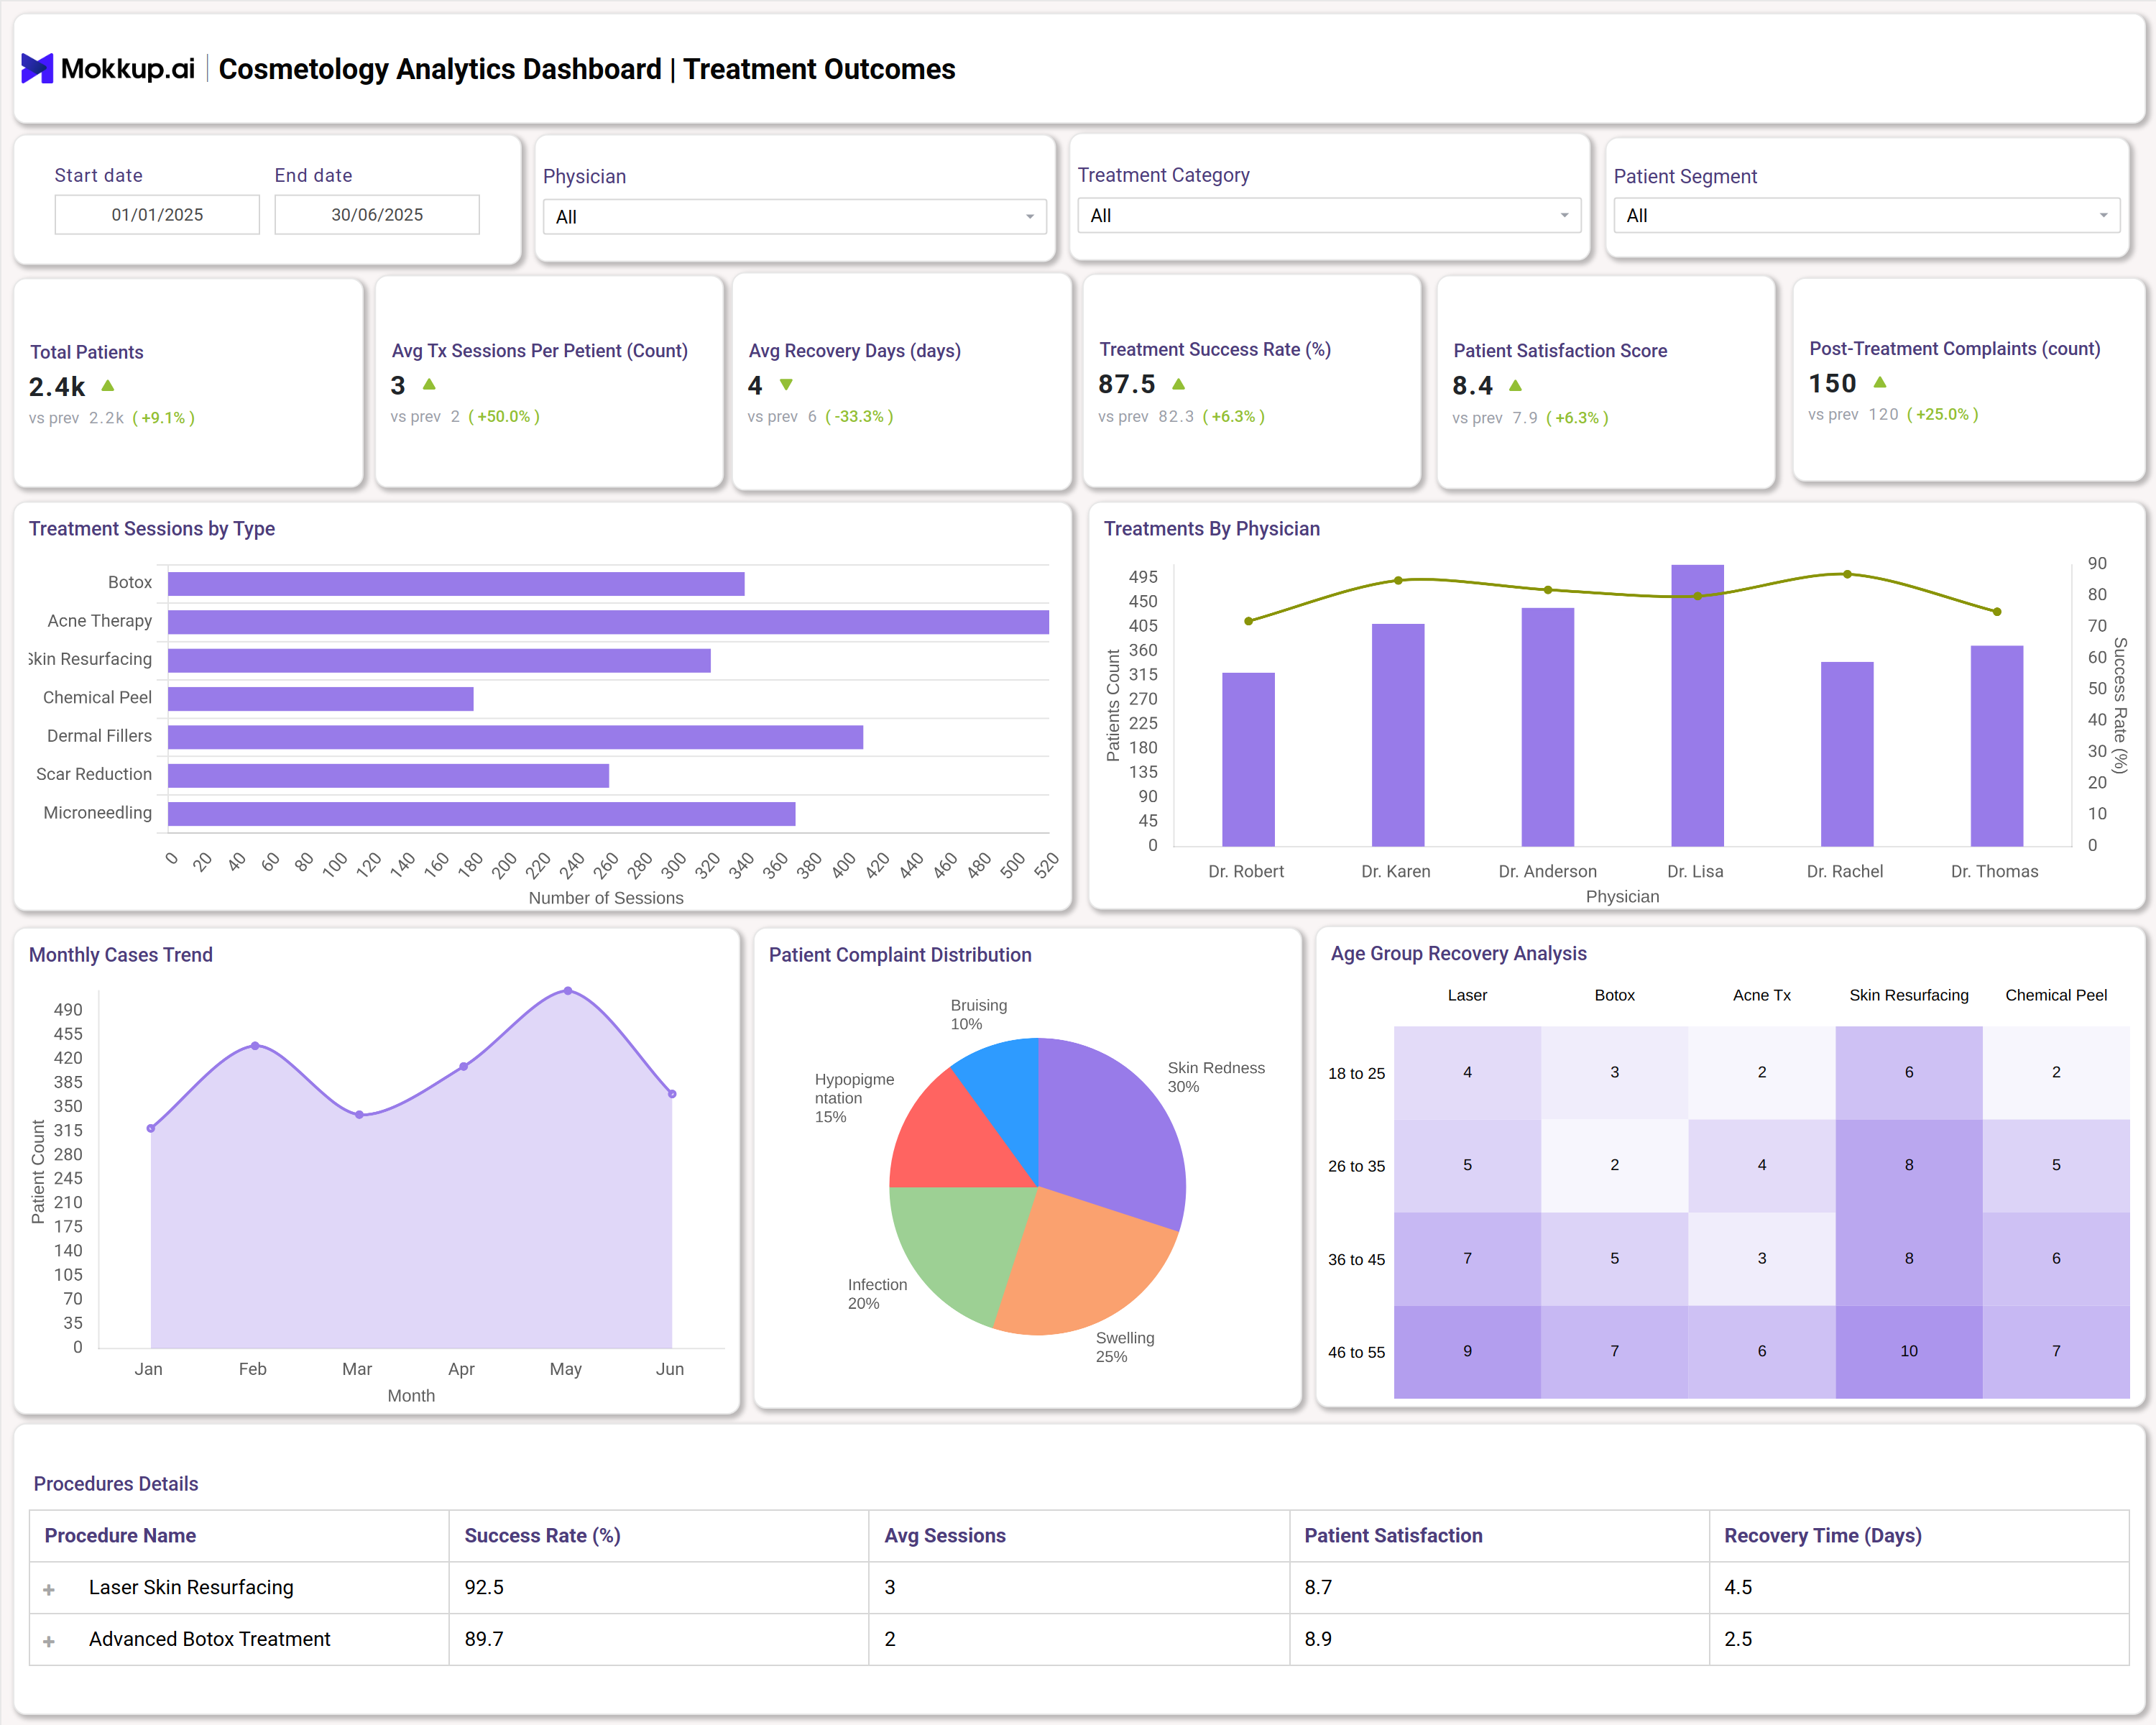
Cosmetology & Aesthetic Services Dashboard Example
A typical Cosmetology & Aesthetic Services Dashboard includes core analytics panels such as Total Revenue, Gross Profit Margin, Procedure Distribution, and Service Category Breakdown. For example, dashboard templates display trends in monthly revenue, profit margins, procedure mix, and doctor productivity. Other panels may report on patient satisfaction scores, recovery times for skin treatments, complaint rates, and detailed success rates for procedures. These modules enable clinics to identify which treatments perform best instantly, track inventory utilization by service, and pinpoint operational bottlenecks across various service categories, doctors, and patient groups.
How to Analyze Data in Cosmetology Dashboards
- Review revenue and profit margin trends to assess financial growth.
- Compare procedure count and cost distribution to monitor high-performing and underutilized services.
- Track client retention and patient satisfaction rates to measure service quality and customer loyalty.
- Monitor recovery times and outcomes by treatment type for clinical performance insights.
- Measure staff or provider productivity by analyzing revenue per procedure and appointment utilization.
- Evaluate complaint trends and adverse event rates to identify quality improvement opportunities.
- Assess booking efficiency and missed appointment rates for resource management.
- Segment and analyze data by service category, provider, or patient demographics for deeper insights.
Benefits of Cosmetology Dashboards
- Centralize all key performance data in one place for quick, informed decision-making.
- Enhance operational efficiency by identifying bottlenecks and optimizing staffing and resource allocation.
- Improve patient outcomes and satisfaction through real-time tracking of treatment success and recovery metrics.
- Increase profitability by drilling into procedure-level profitability and high-value service utilization.
- Strengthen client loyalty through data-driven follow-ups and targeted service offerings.
- Simplify compliance and reporting with automated data collection and visualization.
KPIs to Track in Cosmetology Dashboards
- Total Revenue: Measures all income generated from cosmetic and aesthetic procedures.
- Gross Profit Margin: Shows operational profitability as a percentage of revenue.
- Average Revenue per Procedure: Indicates billing efficiency per treatment session.
- High-Value Procedure Count: Tracks the frequency and performance of top-tier service lines.
- Client Retention Rate: Indicates the percentage of clients who return for additional services.
- Average Treatment Revenue per Client: Measures average spend per unique client.
Frequently Asked Questions
1. What makes a Cosmetology & Aesthetic Services Dashboard different from a generic clinic dashboard?
It is customized for tracking beauty, skincare, and aesthetic clinic operations, featuring metrics most relevant to those services, such as procedure mix, staff productivity, and outcome monitoring.
2. Can dashboards be customized for different specialties or clinic branches?
Yes, most templates allow customization by service category, provider, branch, or demographic group.
3. What is the most important financial KPI for cosmetology businesses?
Gross profit margin and average treatment revenue per client are two of the most important financial KPIs for this sector.