
What is an Automobile Maintenance Report Dashboard?
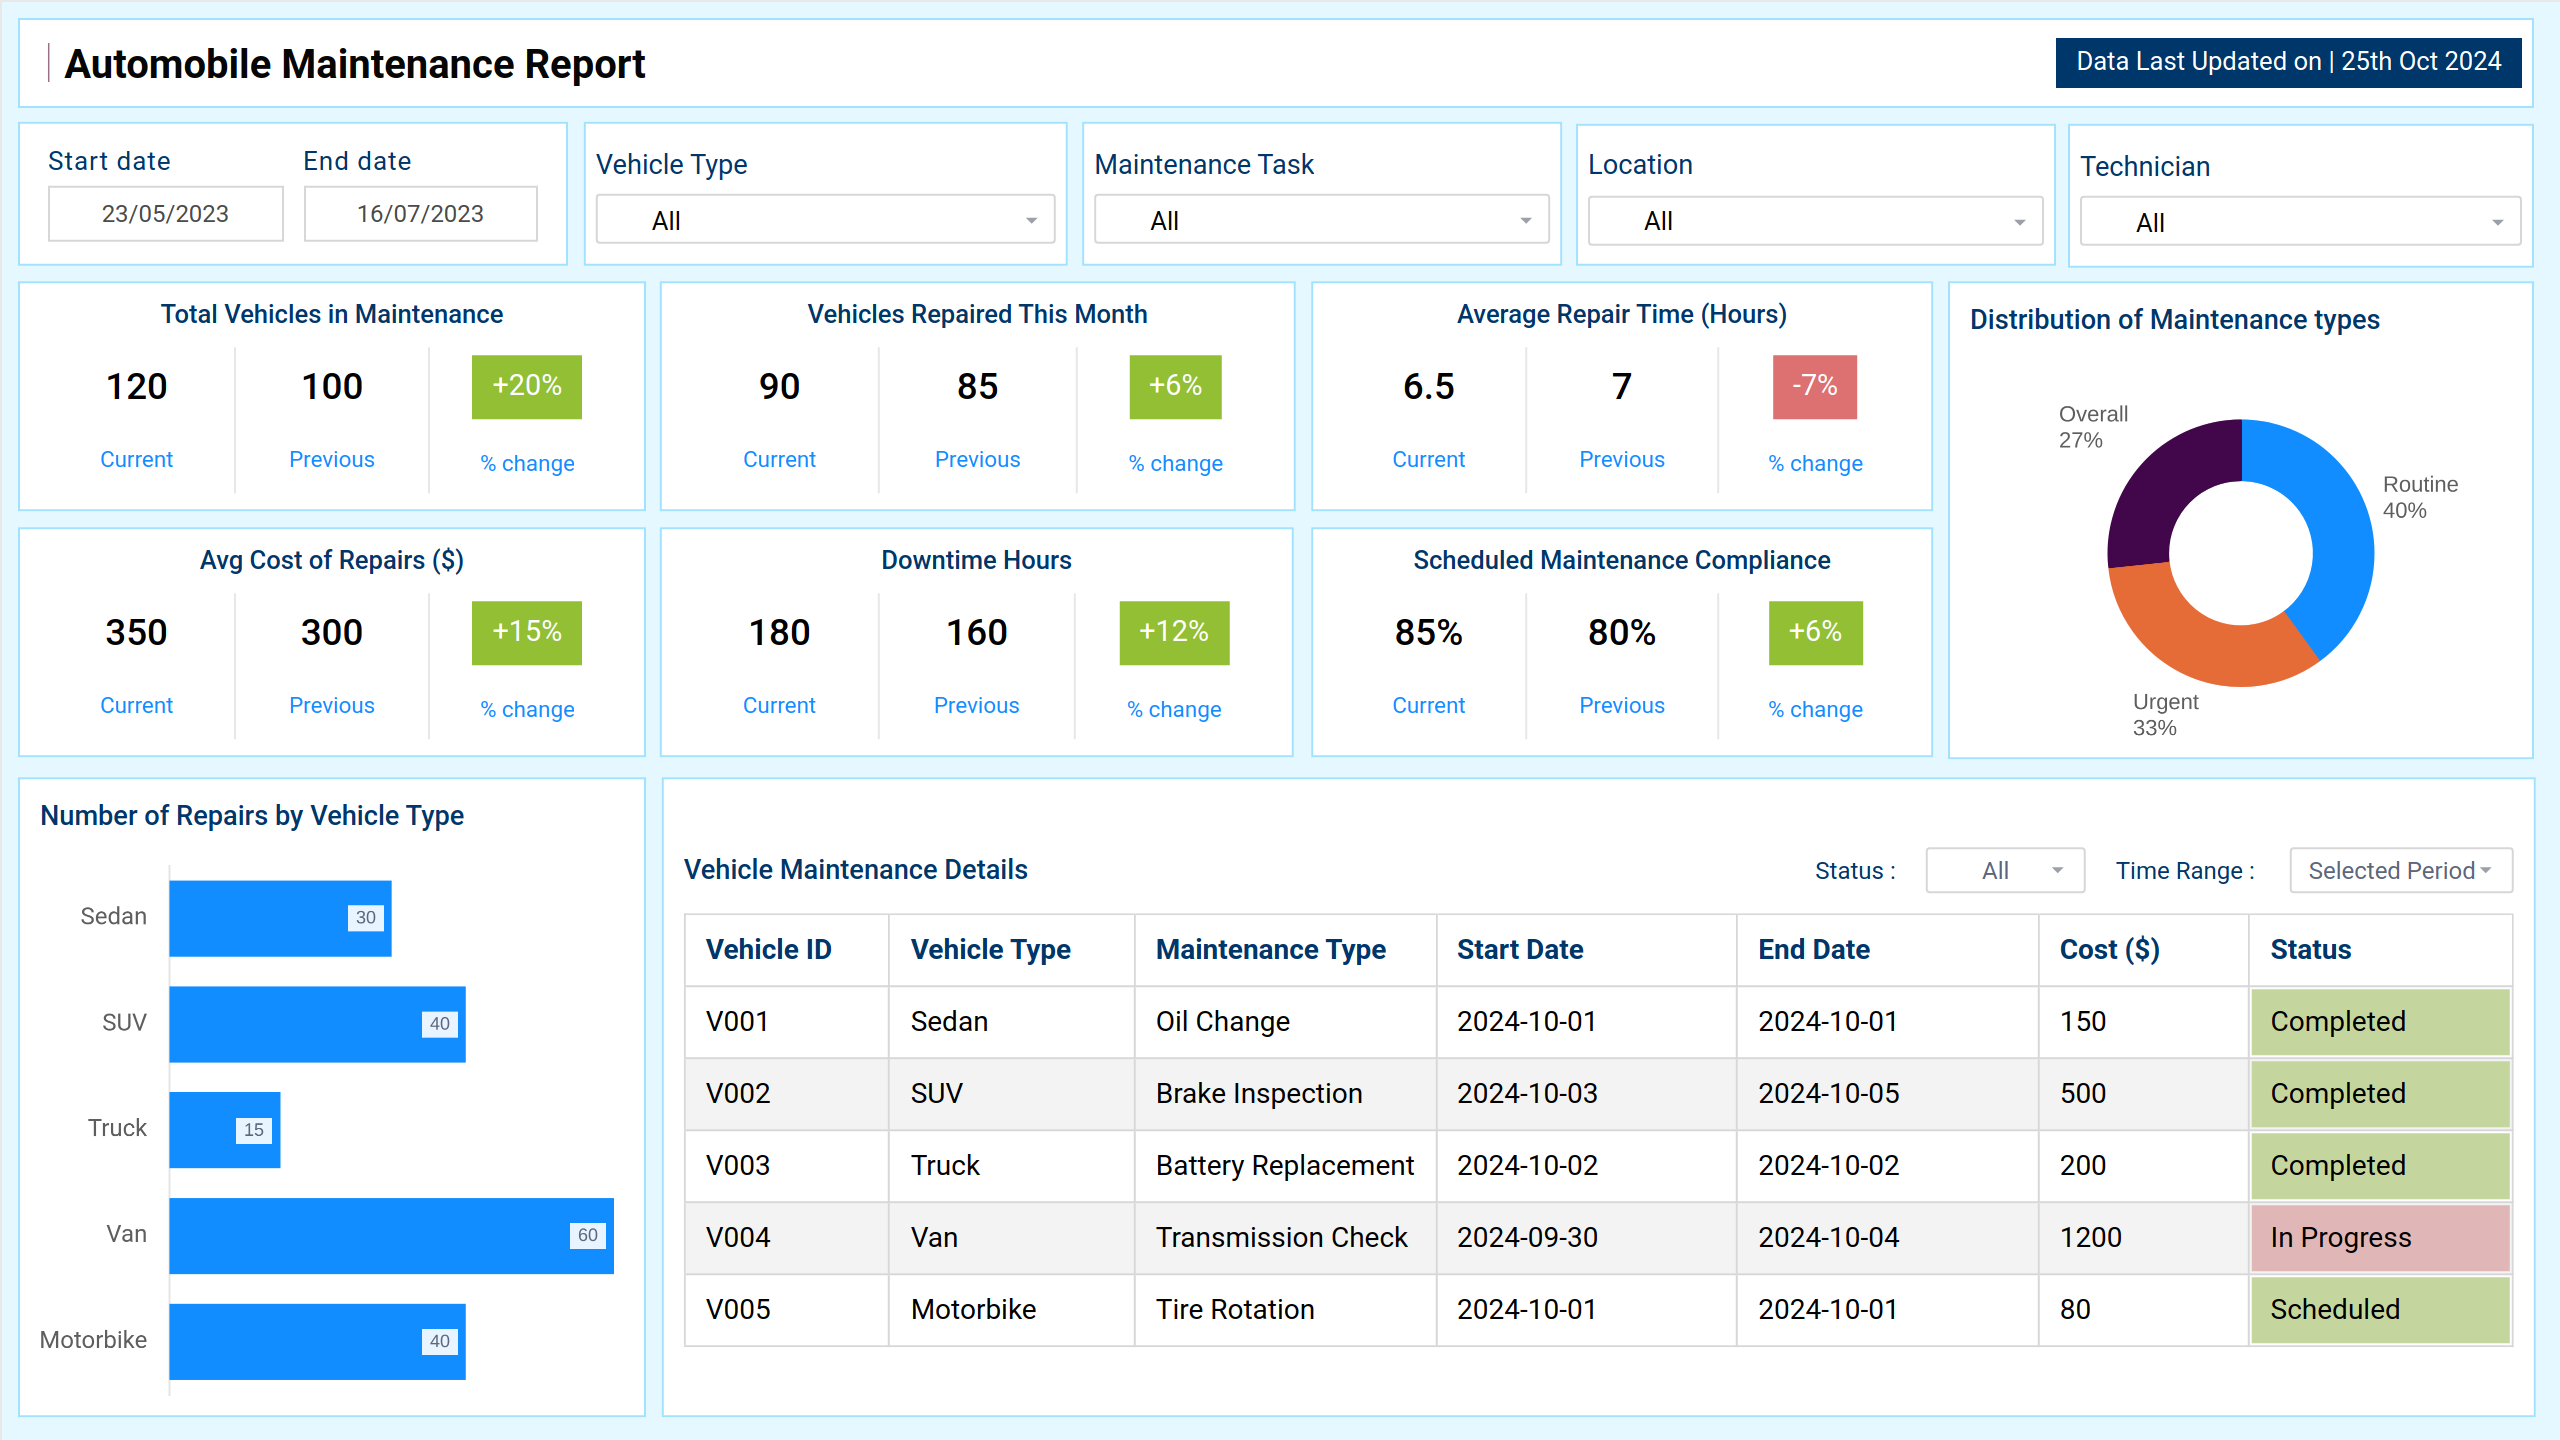
The Automobile Maintenance Report Dashboard template provides insights into vehicle maintenance efficiency, costs, and downtime. It helps track the number of vehicles serviced, repair times, fees, and compliance rates, enabling better fleet maintenance and operational efficiency decision-making.
Automobile Maintenance Dashboard Example
The Automobile Maintenance Dashboard wireframe gives a quick view of vehicle health, service schedules, and repair history. It's useful for fleet managers, service teams, and logistics staff to track inspections, upcoming maintenance, and part replacements.
To get the needed information, you can filter by vehicle type, service date, location, or maintenance type. After adding your data, you can export the dashboard wireframe to Power BI or Tableau for deeper analysis. This helps keep vehicles running smoothly and reduces maintenance costs.
How to Analyze Data in Automobile Maintenance Dashboards
Analyzing the dashboard wireframe helps improve service planning, reduce downtime, and manage costs effectively. Here are a few key steps:
- Check vehicles in maintenance to track workload.
- Monitor repairs this month to assess team performance.
- Review repair time and cost to spot delays or high expenses.
- Track downtime hours to improve fleet availability.
- Use visuals like charts and tables to compare repair types, vehicle categories, and maintenance details.
How to Create an Automobile Maintenance Report
You don’t need to build your report from scratch—just start with a ready-to-use sample Automotive maintenance report dashboard template from Mokkup. Add in your data and export it however you like. Here’s how to do it:
1. Create or Log in to Your Mokkup Account
Start by signing up on Mokkup.ai using your email. Already have an account? Just log in, and you’re good to go.
2. Choose and Customize Your Dashboard Template
Find the Automotive maintenance report dashboard in the Templates section. Use the drag-and-drop editor to adjust KPIs, edit filters, or add elements based on your data.
3. Export to Your BI Tool
Once your dashboard wireframe is ready, use the BI Tool Export feature to send it directly to Power BI or Tableau for further analysis and enhancements. You can also download the dashboard as a PDF, PNG, or JPEG, embed it on a platform, or invite your team to collaborate.
Note: This is a Pro template. To use and customize this dashboard wireframe, you’ll need a Pro subscription on Mokkup. Upgrade anytime to unlock full access.
Benefits of Automobile Maintenance Dashboards
Vehicle maintenance dashboards help track vehicle performance, service needs, and repair history. They make it easier for fleet managers, mechanics, and operations teams to stay on top of regular maintenance and avoid unexpected breakdowns. Here are some key benefits:
- Improved Vehicle Uptime: Regular tracking helps schedule timely maintenance, reducing the chances of sudden breakdowns.
- Cost Savings: By spotting issues early, you can avoid major repairs and keep maintenance costs under control.
- Better Fleet Management: Monitor multiple vehicles simultaneously and make informed decisions about servicing or replacing them.
- Easy Scheduling: Plan and track upcoming services to ensure nothing is missed.
- Data-Driven Insights: Analyze trends in repairs, part replacements, and service frequency to improve future planning.
These dashboards bring clarity and control to vehicle maintenance, keeping operations smooth and efficient.
KPIs to Track in Automobile Maintenance Dashboards
Tracking the right KPIs in an automobi;e maintenance dashboard wireframe helps ensure your vehicles are safe, reliable, and cost-effective. These metrics clearly show how well your fleet is maintained and where improvements are needed. By focusing on key indicators, teams can reduce downtime, manage costs, and make smarter maintenance decisions.
Here are some key KPIs to include:
- Total Vehicles in Maintenance: The number of vehicles currently undergoing maintenance. It helps monitor overall workload and assess resource allocation.
- Vehicles Repaired This Month: The number of vehicles successfully repaired within the month. Measures service center efficiency and throughput.
- Average Repair Time (Hours): The average time taken to complete a repair. Highlights operational efficiency and potential service delays.
- Average Cost of Repairs ($): The typical expense incurred per repair. Helps in budgeting and identifying cost trends in vehicle maintenance.
- Downtime Hours: The total time vehicles remain non-operational due to maintenance. Affects fleet availability and overall operational performance.
- Scheduled Maintenance Compliance: The percentage of scheduled maintenance tasks completed on time. Ensures preventative maintenance adherence, reducing unexpected breakdowns.
Frequently Asked Questions
Q1. How to create an effective vehicle maintenance schedule?
An effective schedule is created by setting regular service intervals, tracking mileage, monitoring usage patterns, and using dashboards to plan upcoming maintenance tasks.
Q2. What metrics are important for fleet management tracking?
Key metrics include total vehicles in maintenance, repair time, repair costs, downtime hours, compliance with scheduled maintenance, and vehicles repaired each month.
Q3. Best practices for automotive service record keeping?
Best practices include maintaining digital records, logging repair history, tracking part replacements, and using dashboards for easy access and analysis of past services.
Q4. How to reduce fleet maintenance costs effectively?
Costs can be reduced by following preventive maintenance, identifying issues early, analyzing repair cost trends, and ensuring timely compliance with service schedules.
Q5. What should be included in vehicle maintenance reports?
A complete report should cover service history, repair costs, downtime, compliance rates, vehicle health status, and upcoming maintenance schedules.