
What is an Agricultural Post-Harvest Operations Dashboard?
An Agricultural Post-Harvest Operations Dashboard template is an intelligent monitoring and analytics tool designed to help agri-businesses, cooperatives, and logistics companies track critical post-harvest performance metrics. Organizations can use this post-harvest operations dashboard wireframe to monitor spoilage rates, cold chain integrity, storage utilization, and handling compliance to improve efficiency and minimize losses across the agricultural supply chain.
By consolidating key indicators from farms, storage facilities, and transport systems, this agricultural logistics dashboard wireframe ensures better decision-making. It helps businesses optimize their crop flow from harvest to sale while improving sustainability and profitability.
How to Create an Agricultural Post-Harvest Operations Dashboard
You don’t need to build your report from scratch—just start with a ready-to-use sample Agricultural Post-Harvest Operations Dashboard template from Mokkup. Plug in your own data and export it however you like. Here’s how to do it:
1. Create or Log in to Your Mokkup Account
Start by signing up on Mokkup.ai using your email. Already have an account? Just log in, and you’re good to go.
2. Choose and Customize Your Dashboard Template
Find the Agricultural Post-Harvest Operations Dashboard template in the Templates section. Use the drag-and-drop editor to adjust KPIs, edit filters, or add elements based on your data.
3. Export to Your BI Tool
Once your dashboard is ready, use the BI Tool Export feature to send it directly to Power BI or Tableau for further analysis and enhancements. You can also download the dashboard as a PDF, PNG, or JPEG, embed it on a platform, or invite your team to collaborate.
Note: This is a Pro template. To use and customize this dashboard wireframe, you’ll need a Pro subscription on Mokkup. Upgrade anytime to unlock full access.
Agricultural Post-Harvest Operations Dashboard Example
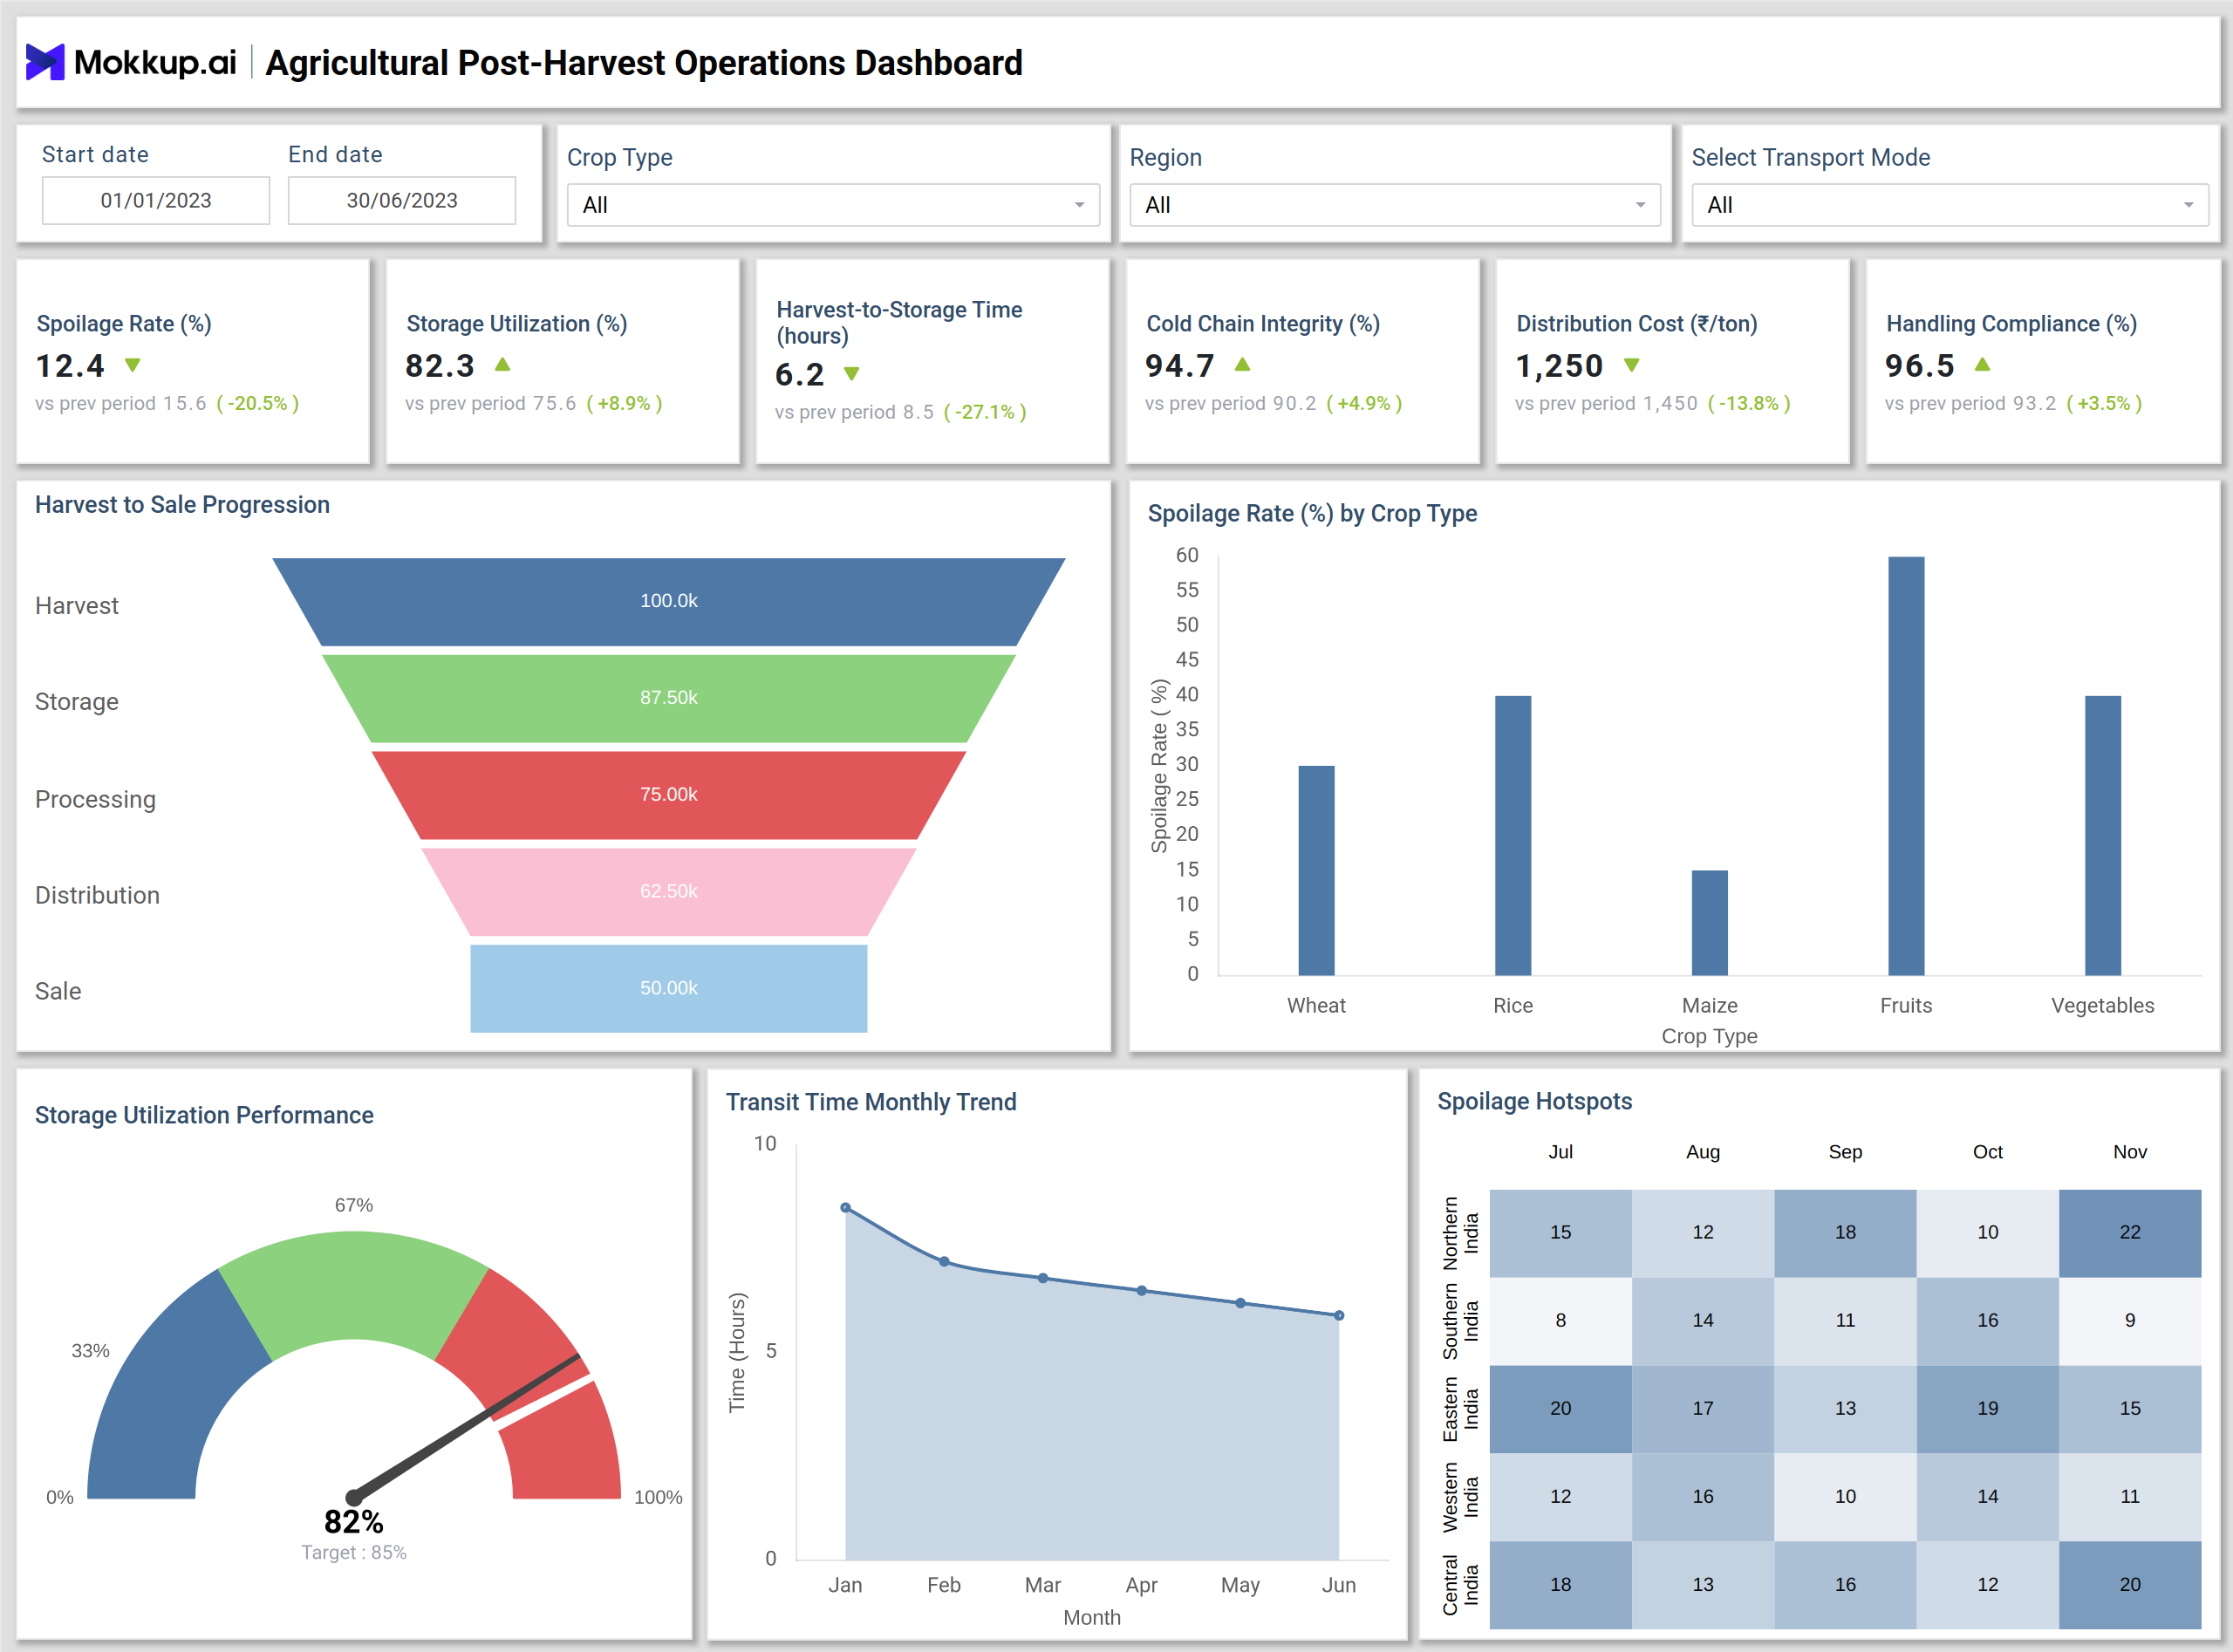
A practical Agricultural Post-Harvest Operations Dashboard Example helps visualize performance across the entire post-harvest lifecycle, from crop collection to distribution. Harvest-to-Sale Progression Funnel shows how product quantity decreases at each stage, from harvest to processing to sale, a critical view for any agricultural logistics dashboard. Charts such as Spoilage Rate by Crop Type identify problem crops like fruits and vegetables that contribute most to losses, while the Storage Utilization Gauge displays overall facility efficiency. Meanwhile, Transit Time Trend and Regional Spoilage Hotspot Heatmaps enable managers to track logistics delays and regional inefficiencies.
This post-harvest operations dashboard helps agribusinesses to make data-driven interventions that reduce waste, cut costs, and strengthen their cold chain networks.
How to Analyze Data in Agricultural Post-Harvest Dashboards
To leverage the agricultural supply chain efficiency dashboard, you can:
- Monitor Spoilage Rate Analytics: Track spoilage percentages across crop types and regions to identify product loss patterns.
- Evaluate Cold Chain Integrity: Assess temperature stability and cold storage conditions to maintain quality during transport.
- Compare Harvest-to-Storage Times: Analyze time gaps between harvest and storage to pinpoint process inefficiencies.
- Track Storage Utilization (%): Measure warehouse capacity usage to balance inventory and prevent overstocking or underuse.
- Identify Regional Spoilage Hotspots: Detect geographic areas with higher spoilage rates for targeted process improvements.
- Measure Distribution Cost per Ton: Analyze transportation expenses to optimize logistics and reduce operational costs.
- Review Handling Compliance: Ensure safety and hygiene standards are adhered to across the post-harvest process.
Through this analysis, stakeholders can ensure smooth logistics, minimize loss, and enhance post-harvest performance tracking.
Benefits of Agricultural Post-Harvest Operations Dashboards
The dashboard wireframe helps agricultural teams monitor post-harvest efficiency, reduce wastage, and optimize logistics through data-driven insights.
- Reduce Crop Spoilage: Gain control over temperature, storage, and transit conditions.
- Improve Cold Chain Efficiency: Maintain ideal environments for perishable crops.
- Enhance Storage Utilization: Identify underused or overloaded facilities.
- Cut Distribution Costs: Optimize supply routes and fuel usage.
- Boost Compliance: Track handling and hygiene standards with data-driven precision.
- Achieve Agricultural Supply Chain Efficiency: Centralize real-time data for smarter decisions.
These benefits tie back to the agricultural logistics dashboard insights, ensuring sustainable, efficient, and cost-effective operations.
KPIs to Track in Agricultural Post-Harvest Operations Dashboards
Tracking the right KPIs within your post-harvest operations dashboard ensures your agricultural processes remain efficient and data-driven:
- Spoilage Rate (%): Measures product loss due to poor storage or delayed transport.
- Storage Utilization (%): Evaluates capacity use across cold and dry storage units.
- Harvest-to-Storage Time (hrs): Tracks speed and efficiency from harvest to storage.
- Cold Chain Integrity (%): Ensures temperature consistency during transport.
- Distribution Cost (₹/ton): Assesses overall logistics cost-efficiency.
- Handling Compliance (%): Evaluates adherence to crop handling and hygiene standards.
- Transit Time (hrs): Analyzes delays between stages of transport.
- Spoilage Hotspots (regions): Identifies high-risk regions to focus improvements.
These KPIs together form the backbone of any post-harvest performance tracking initiative.
Frequently Asked Questions
Q1. Who uses an Agricultural Post-Harvest Operations Dashboard?
Agricultural cooperatives, logistics firms, government bodies, and agri-tech startups use this dashboard to optimize storage and transport.
Q2. What are the most important metrics to track?
Key metrics include spoilage rate, storage utilization, distribution cost, and cold chain integrity.
Q3. How does this dashboard improve post-harvest operations?
By providing real-time analytics that reveal inefficiencies, ensuring optimal agricultural supply chain efficiency from farm to market.