What is a Pharmacy Claims Intelligence Dashboard?
A pharmacy claims intelligence dashboard is a comprehensive digital platform that enables healthcare organizations, pharmacy benefit managers, and insurers to monitor, analyze, and optimize prescription claims. This dashboard consolidates data from multiple claim sources, transforming it into actionable insights that enhance decision-making. It helps identify cost drivers, monitor member utilization patterns, and track key claim performance metrics, including plan costs, ingredient costs, and specialty drug utilization. By visualizing claims data, the pharmacy claims analytics dashboard tool simplifies complex data into interactive visual summaries that support strategic cost management and operational efficiency. It empowers pharmacy administrators to control claim expenses, detect inefficiencies, and enhance benefit design strategies.
How to Create a Pharmacy Claims Intelligence Dashboard
You don’t need to build your report from scratch—just start with a ready-to-use dashboard template from Mokkup. Add in your data and export it however you like. Here’s how to do it:
1. Create or Log in to Your Mokkup Account
Start by signing up on Mokkup.ai using your email. If you already have an account, just log in, and you’ll be good to go.
2. Choose and Customize Your Dashboard Template
Find the Pharmacy Claims Intelligence Dashboard template in the Templates section. Use the drag-and-drop editor to adjust KPIs, edit filters, or add elements based on your data.
3. Export to Your BI Tool
Once your dashboard wireframe is ready, use the BI Tool Export feature to send it directly to Power BI or Tableau for further analysis and enhancements. You can also download the dashboard as a PDF, PNG, or JPEG, embed it on a platform, or invite your team to collaborate.
Note: This is a Pro template. You’ll need a Pro subscription on Mokkup to use and customize this dashboard wireframe. Upgrade anytime to unlock full access.
Pharmacy Claims Intelligence Dashboard Example
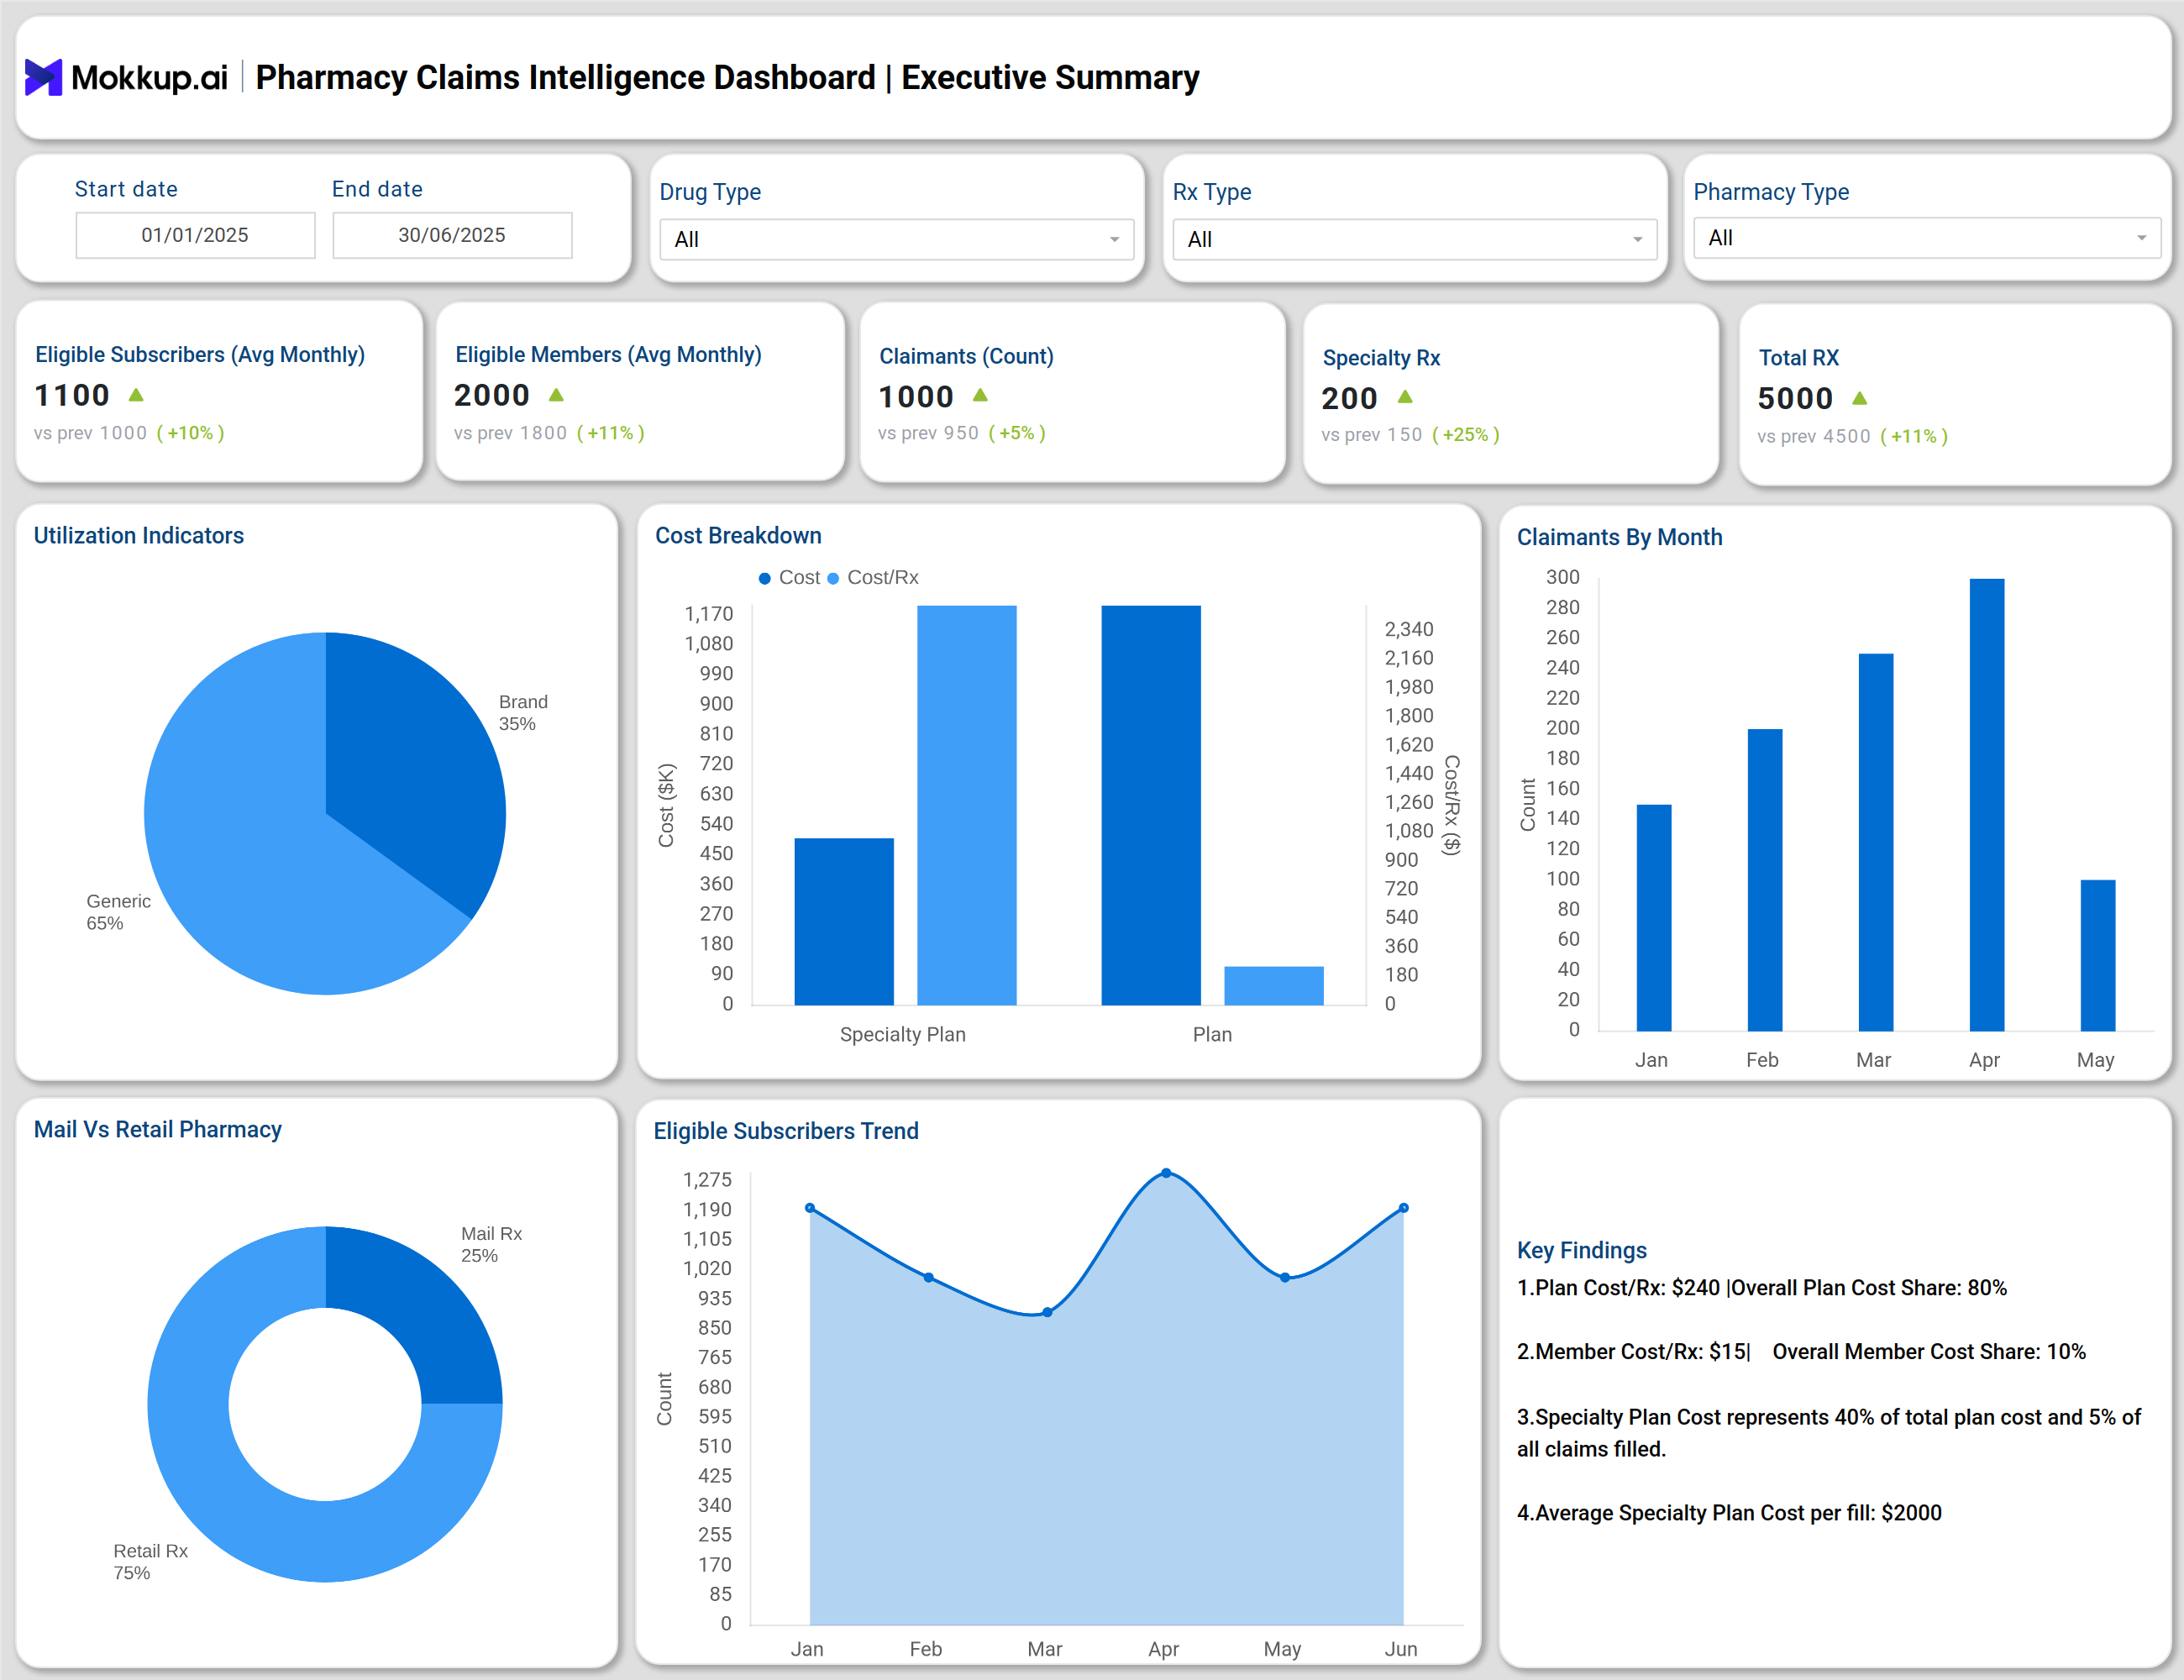
You can create a pharmacy claims intelligence dashboard that combines multiple analytical views to provide a comprehensive understanding of pharmacy claim patterns across cost, utilization, demographics, and risk. The Executive Summary screen gives a high-level overview of total prescriptions, specialty claims, and the balance between plan and member costs. The Cost Indicators dashboard breaks down ingredient expenses, plan costs, and branding expenses, offering clear visibility into overall claim spending trends through a pharmacy claims data insights dashboard that highlights key cost drivers and utilization metrics.
The Demographics screen presents detailed insights into claimants by age, gender, and relationship type, helping identify patterns in prescription usage across different population groups. The GLP-1 Utilization dashboard highlights therapy performance for diabetes and obesity treatments, illustrating how costs and utilization vary across different drug types. The High-Cost Claimants Analysis identifies members who contribute most to overall plan costs, allowing organizations to focus on cost containment and improved claim management with the help of a pharmacy claims review and optimization dashboard that ensures transparency, accuracy, and performance tracking. Additional views, such as Specialty Drug and Ingredient Cost dashboards, provide deeper insights into specialty medication expenses and ingredient cost performance. The Top Drugs dashboard lists medications contributing most to prescription volume and spending, helping pharmacy benefit managers optimize their formulary and cost strategies.
Together, these modules make the pharmacy claims analytics dashboard tool a vital platform for transforming raw pharmacy claim data into actionable insights, driving informed decision-making, and enhancing pharmacy operations.
How to Analyze Data in the Pharmacy Claims Intelligence Dashboard
Here is how you can analyze data from this dashboard:
- Review Executive KPIs: Begin with key metrics, including total prescriptions, plan cost, ingredient cost, and specialty Rx volume.
- Identify Cost Drivers: Use the cost breakdown charts to distinguish between plan, ingredient, and compound costs.
- Monitor Utilization Patterns: Analyze utilization indicators to compare generic vs. brand fills and mail vs. retail distribution.
- Track Member Demographics: Examine claimant age bands, gender ratios, and relationship-based trends to detect high-cost or high-use groups.
- Assess Specialty Drug Performance: Review the GLP-1 and Specialty Drugs dashboards to track utilization efficiency and specialty plan share.
- Focus on High-Cost Claimants: Utilize the High-Cost Claimants dashboard to identify outliers that exceed set thresholds and manage financial exposure.
- Analyze Ingredient Cost Trends: Observe ingredient cost per Rx and single-source brand behavior to monitor procurement efficiency.
- Review Top Drug Rankings: Track the top 10 drugs by cost and volume to prioritize formulary adjustments.
- Leverage Glossary Definitions: Utilize the built-in glossary to understand financial metrics such as PMPM, PEPM, and Plan Cost Share.
Benefits of Pharmacy Claims Intelligence Dashboard
- Enables end-to-end visibility of claims costs through consolidated financial and clinical data.
- Supports data-driven decision-making with interactive visual analytics and trend indicators.
- Enhances pharmacy benefit management by monitoring ingredient costs, plan costs, and member utilization.
- Helps detect inefficient claim patterns and unnecessary specialty drug usage.
- Optimizes drug formulary design by identifying high-impact drugs driving plan expenses.
- Strengthens financial compliance and transparency across healthcare organizations.
- Facilitates benchmarking and forecasting using monthly and year-over-year claim trend visualizations.
- Provides actionable claim insights for reducing overall cost-per-member metrics.
KPIs to Track in Pharmacy Claims Intelligence Dashboard
- Total Prescriptions (Rx): Measures total claim volume processed during the selected period.
- Ingredient Cost (USD): Tracks the total ingredient cost, including discounts and adjustments.
- Plan Cost (USD): Represents the total cost covered by insurance or the pharmacy plan.
- Plan Cost (PMPM /PEPM): Indicates the average cost per member or employee per month.
- Specialty Plan Cost: Monitors specialty drug plan spending and its share of total costs.
- Average Member Cost per Rx: Evaluates patient out-of-pocket cost efficiency.
- Brand vs. Generic Fill Rate: Identifies cost-saving opportunities through the adoption of generics.
- High-Cost Claimant Share (%): Highlights the contribution of top claimants to overall cost.
- Ingredient Cost per Rx: Helps measure procurement and pricing efficiency.
- Claimant Demographics: Tracks claim distribution by age, gender, and relationships.
Frequently Asked Questions
1. What is the purpose of a pharmacy claims intelligence dashboard?
The dashboard centralizes all pharmacy claims data, helping organizations track costs, analyze utilization patterns, and optimize benefit design for improved cost control.
2. Who uses a pharmacy claims analytics dashboard tool?
It is used by pharmacy benefit managers, insurers, healthcare analysts, and administrators for performance tracking, financial analysis, and compliance monitoring.
3. How does this dashboard improve cost efficiency?
By highlighting plan cost drivers, identifying high-cost drugs, and comparing generic vs. brand utilization, it supports data-backed cost containment decisions.
4. How often should claims data be reviewed?
Monthly monitoring is recommended using the pharmacy claims performance monitoring dashboard to identify early deviations and improve claim turnaround accuracy.