
What is an Ad Revenue and Engagement Insights Dashboard?
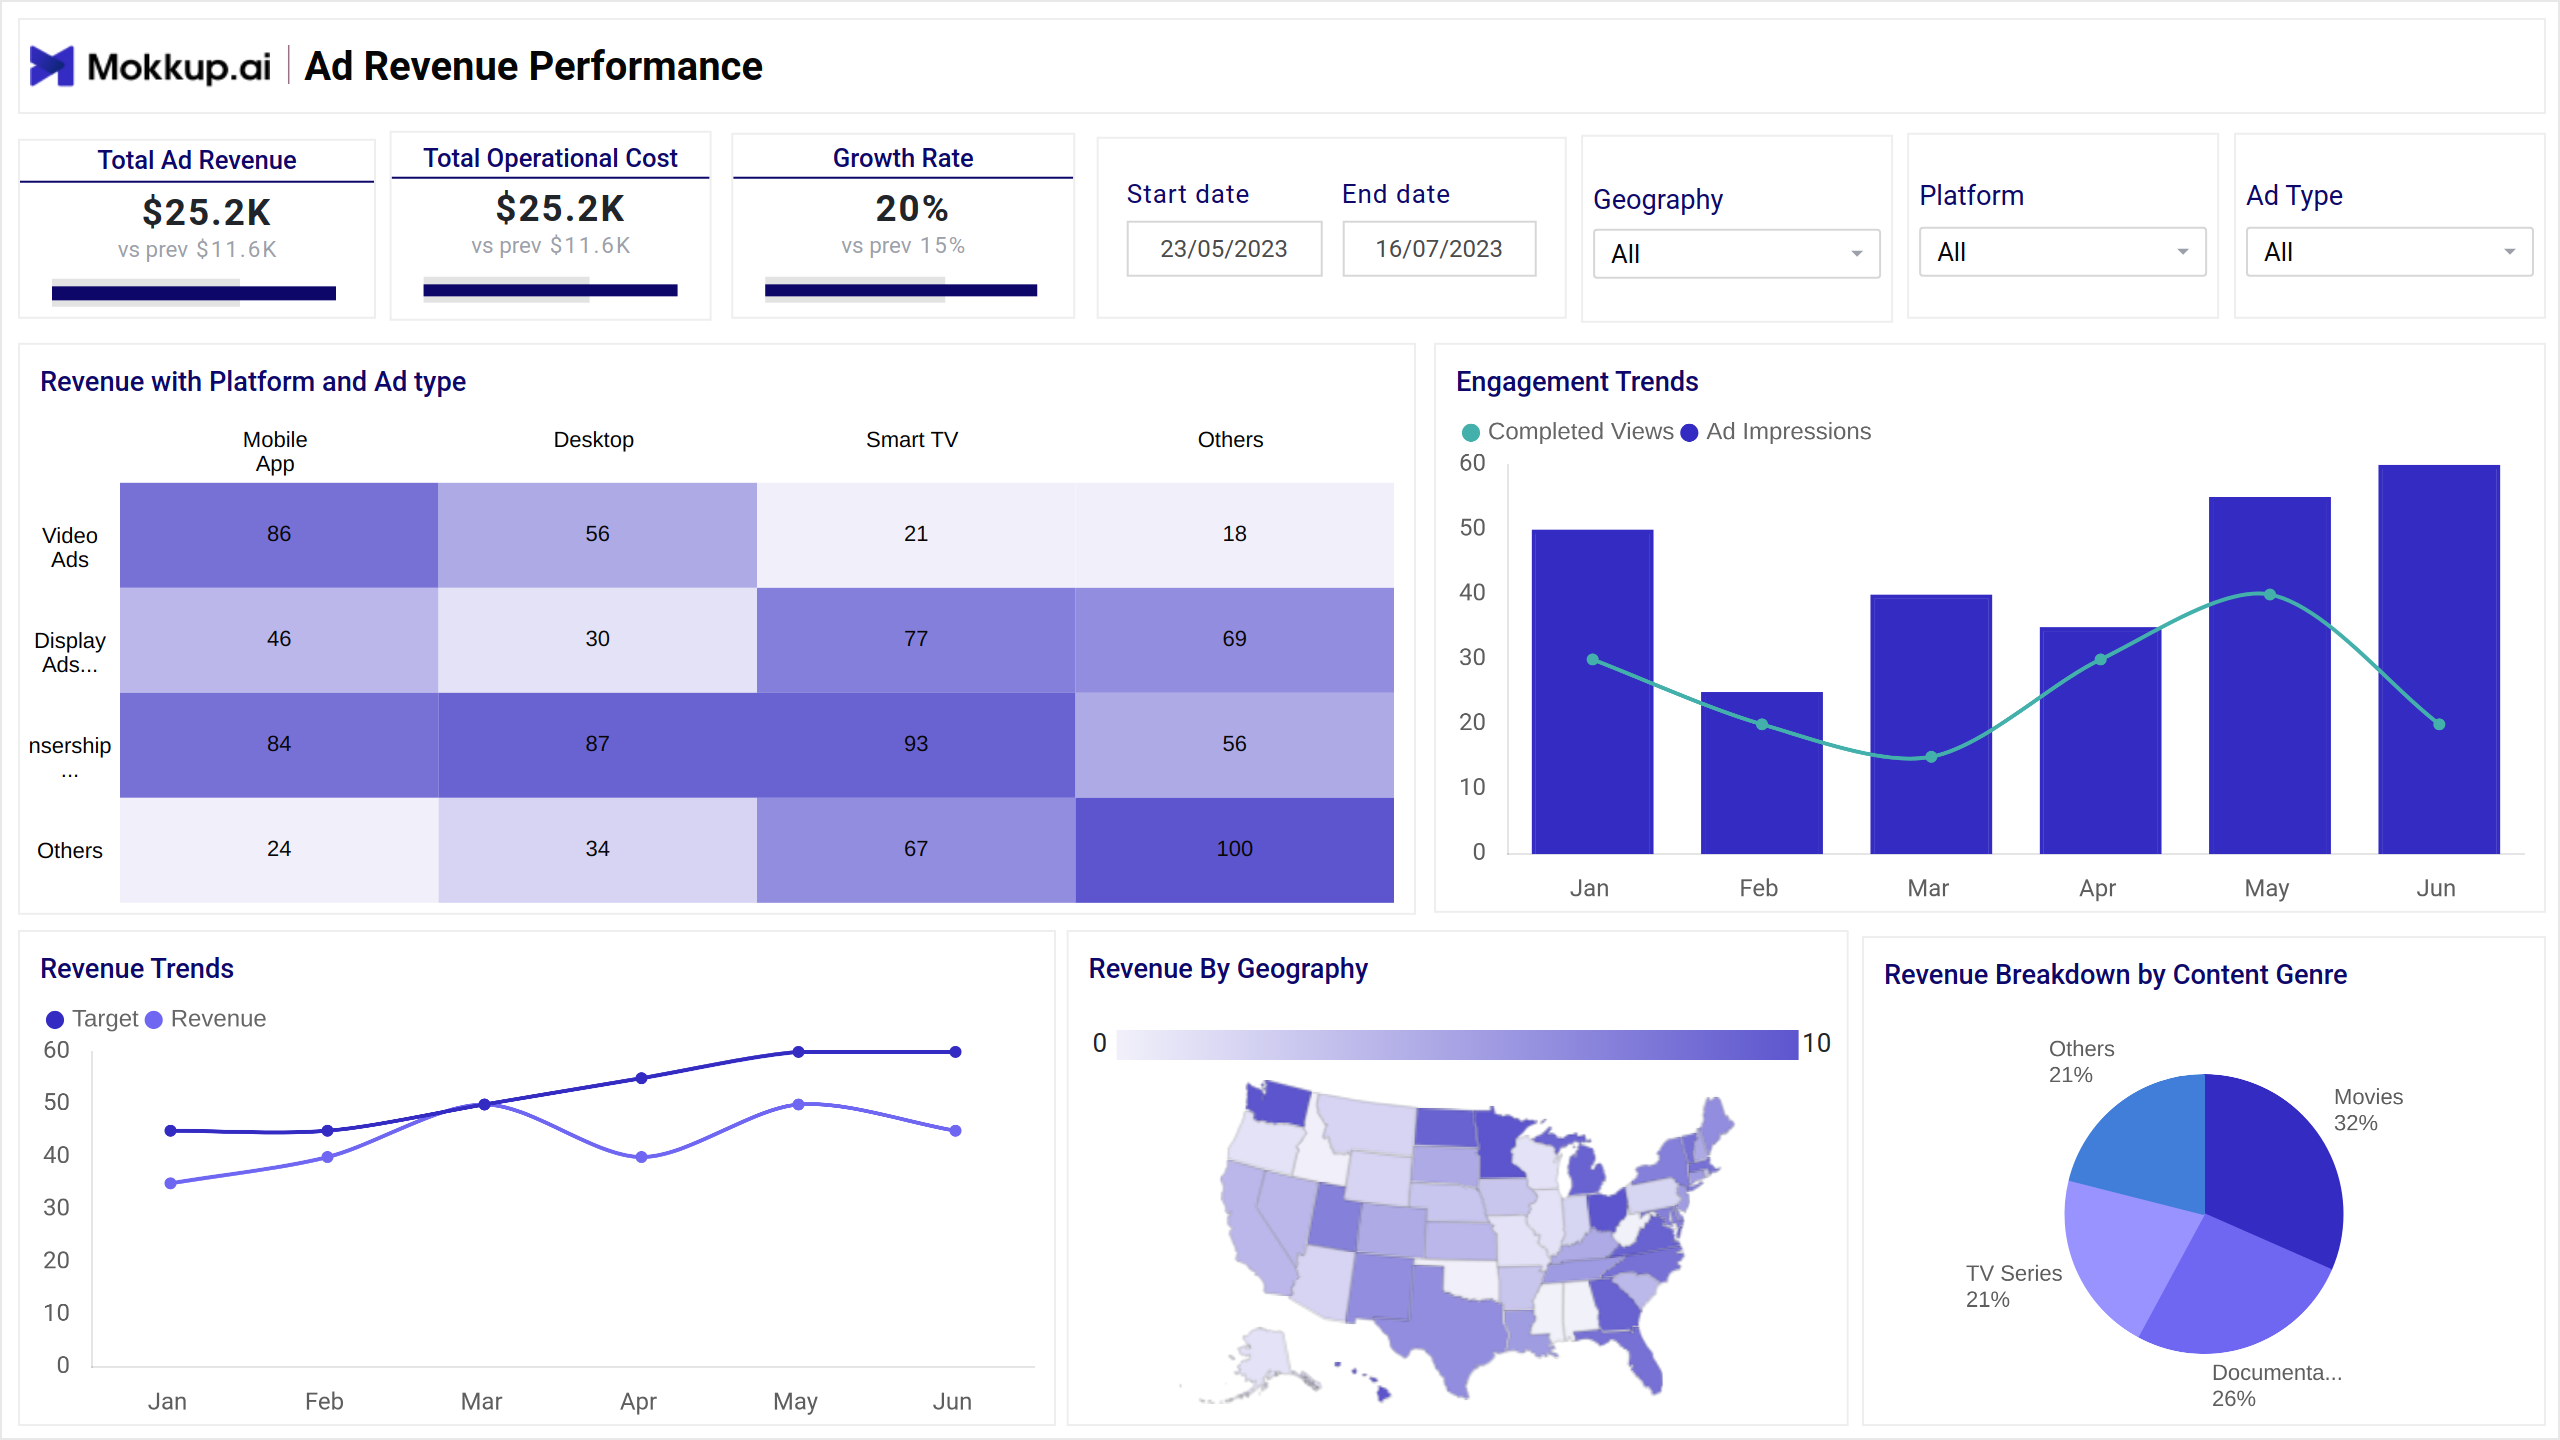
An Ad Revenue and Engagement Insights Dashboard template monitors and analyzes advertising performance across platforms. It offers real-time insights into revenue generation, audience engagement metrics (such as impressions, clicks, and view time), and campaign effectiveness, helping marketing and finance teams optimize strategy by channel, region, and ad format.
Ad Revenue and Engagement Dashboard Example
The Ad Revenue and Engagement Insights Dashboard template gives marketing and ad operations teams a clear, centralized view of monetization and engagement trends across platforms. This dashboard wireframe helps monitor the performance of different ad types (display, video, native), evaluate platform ROI, and improve audience targeting strategies by identifying which campaigns, regions, or creatives drive the most engagement and revenue.
How to Analyze Data in Ad Engagement Dashboards
The Mokkup.ai Ad Analytics template helps marketing teams track campaign performance, optimize ad spend, and improve audience engagement.
- Start by monitoring total ad revenue, costs, and growth using KPI cards to spot financial trends and performance shifts.
- Use heatmaps and pie charts to analyze revenue by platform, ad type, and content genre, helping identify top-performing combinations.
- Review impressions, completed views, and engagement trends to find peak interaction times and adjust content scheduling.
- Evaluate RoAS, CTR, and conversion rates through funnel visuals and campaign comparisons to fine-tune strategy.
This dashboard enables faster, data-backed decisions by revealing what’s working and where adjustments are needed.
How to Create an Ad Revenue & Engagement Dashboard
You don’t need to build your report from scratch—just start with a ready-to-use sample Ad Revenue and Engagement Insights Dashboard template from Mokkup. Add in your data and export it however you like. Here’s how to do it:
1. Create or Log in to Your Mokkup Account
Start by signing up on Mokkup.ai using your email. Already have an account? Just log in, and you’re good to go.
2. Choose and Customize Your Dashboard Template
Find the Ad Revenue and Engagement Insights Dashboard in the Templates section. Use the drag-and-drop editor to adjust KPIs, edit filters, or add elements based on your data.
3. Export to Your BI Tool
Once your dashboard wireframe is ready, use the BI Tool Export feature to send it directly to Power BI or Tableau for further analysis and enhancements. You can also download the dashboard as a PDF, PNG, or JPEG, embed it on a platform, or invite your team to collaborate.
Note: This is a Pro template. To use and customize this dashboard wireframe, you’ll need a Pro subscription on Mokkup. Upgrade anytime to unlock full access.
Benefits of Ad Revenue & Engagement Dashboards
Ad Revenue and engagement Dashboard templates are essential tools for tracking the performance of advertising campaigns across platforms and formats. They provide actionable insights into revenue generation and audience interaction, helping teams fine-tune strategies for better results.
Here are the key benefits of using them:
- Centralized Ad Performance View: Consolidates revenue, cost, and engagement metrics across platforms into a single dashboard for easier monitoring.
- Improved ROI Tracking: Helps advertisers measure Return on Ad Spend (RoAS) and identify which campaigns deliver the best returns.
- Audience Behavior Insights: Analyzes viewer engagement, impressions, and click-through rates to understand what content resonates.
- Campaign Optimization: Highlights underperforming ads, regions, or platforms, allowing marketers to reallocate budgets more effectively.
- Real-Time Decision Making: Enables quick adjustments based on live data trends, improving the impact of ongoing campaigns.
These dashboards turn complex ad data into clear visuals, helping teams boost ad efficiency and improve customer targeting.
KPIs to Track in Ad Revenue Dashboards
Ad Revenue Dashboards rely on a set of KPIs to evaluate campaign effectiveness, track spend efficiency, and understand audience engagement. These metrics help marketers measure financial performance and identify areas for improvement.
Here are the key KPIs to track:
- Total Ad Revenue: Tracks the total revenue generated from ad campaigns across platforms.
- Total Operational Cost: Displays the total expenses incurred in executing ad campaigns.
- Growth Rate: Measures the percentage increase in revenue or engagement over time.
- Total Spend: Indicates the total expenditure on ad campaigns, including media and platform costs.
- Revenue: Shows the overall revenue earned during a specific campaign or time period.
- Return on Ad Spend (RoAS): Calculates how much revenue is earned for every unit of currency spent on ads.
- Click-Through Rate (CTR): Measures how often users click on ads after viewing them—an indicator of ad relevance and interest.
- Conversion Rate: Tracks the percentage of users who completed a desired action after interacting with an ad, such as purchases or sign-ups.
Frequently Asked Questions
Q1. What does this dashboard help with?
It tracks ad revenue, spend, and engagement across platforms to assess campaign performance.
Q2. How do I measure ad effectiveness?
Use KPIs like RoAS, CTR, and conversion rate to evaluate results and identify what’s working.
Q3. Can I view platform-wise performance?
Yes, filters let you drill down by platform, region, and ad type for detailed insights.