
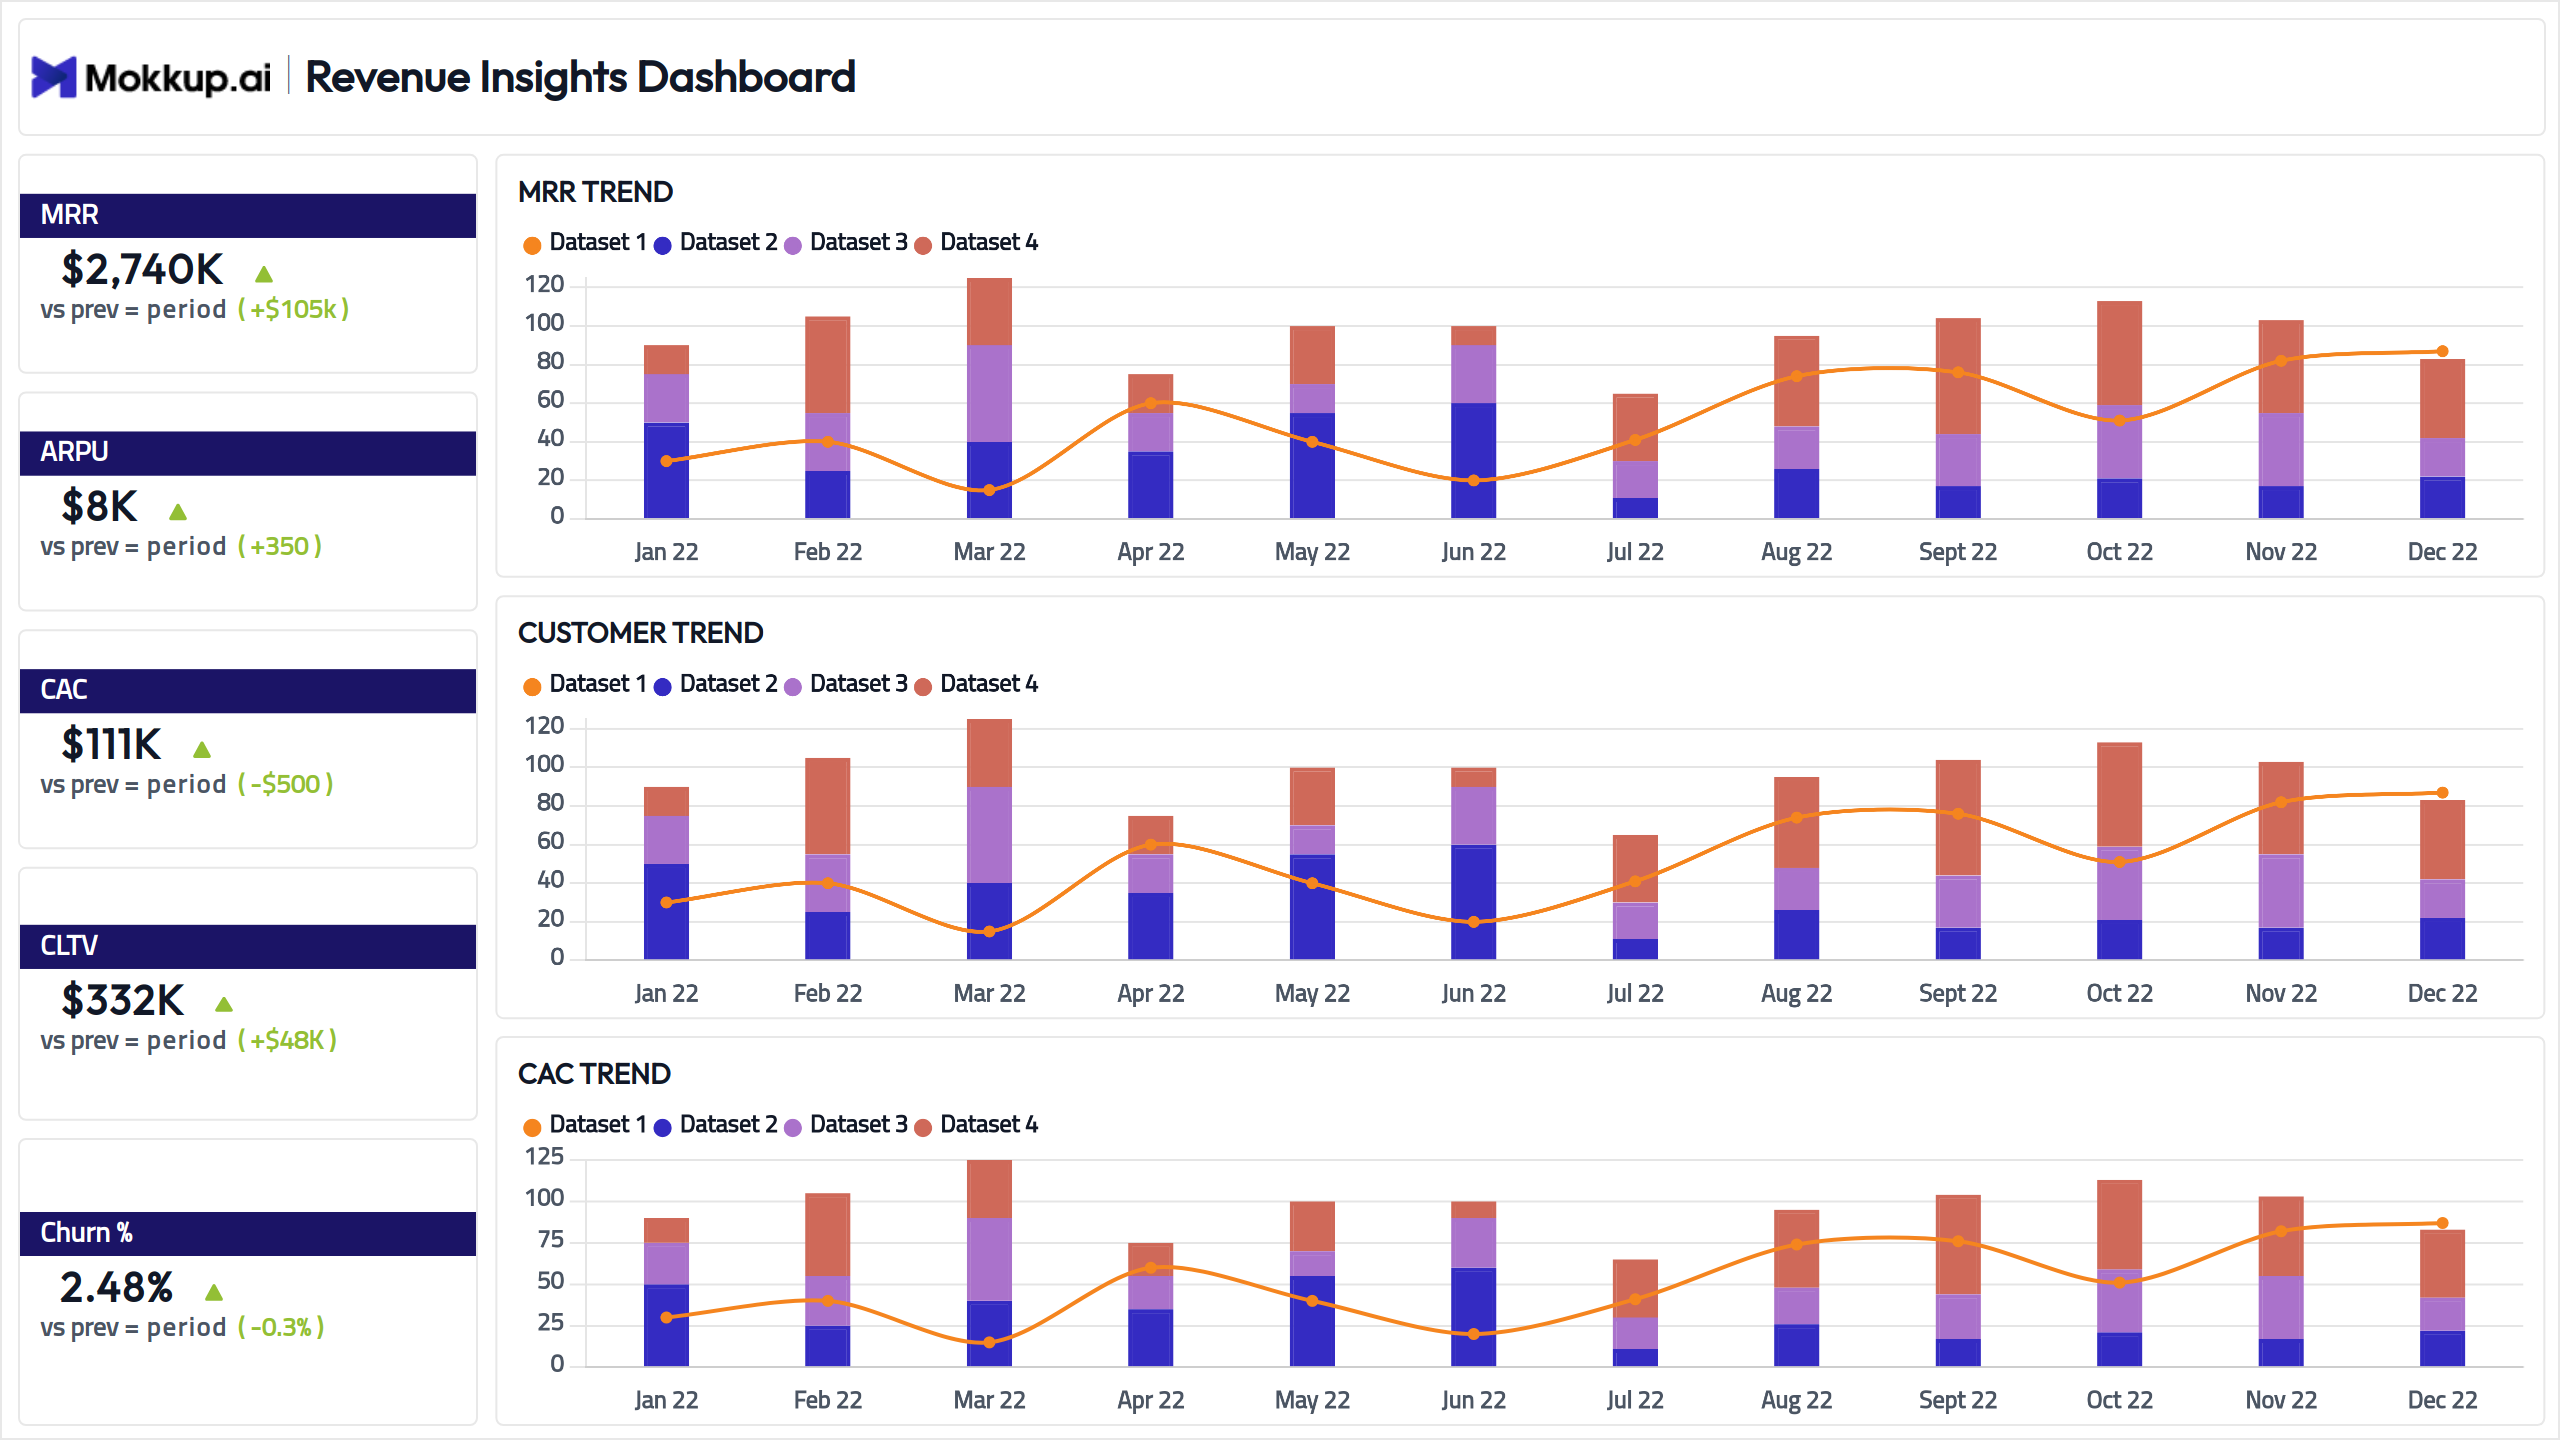
In most industries, most revenue is collected at the time of purchase. In the SaaS industry, revenue is evenly distributed over a period of time. This revenue, or MRR, is the revenue a company expects to earn each month regularly. MRR can be further broken down into New, Expansion, Churn, and Downgrade MRR to analyze financial growth and productivity in more detail.
This dashboard template offers businesses a clear view of revenue generated from individual customers, enabling strategic decision-making to maximize profitability. By analyzing key metrics such as average revenue per user, customer lifetime value, etc, over time, businesses can identify high-value customers and tailor retention efforts accordingly.
Key Terms to Know
- Monthly Recurring Revenue (MRR) - Revenue a company expects to earn monthly.
- Average Revenue Per User (ARPU) – Revenue generated per user.
- Customer Acquisition Cost (CAC) - The company's average customer acquisition cost.
- Customer Lifetime Value (CLTV) - The total value that a customer brings to the company over their entire time as a customer.
- Churn - The % of customers who leave the company (typically calculated for a month).
Dashboard Template Insights
Overall, this dashboard wireframe is a valuable tool for SaaS businesses of all sizes. Here are some of the benefits:
- Identify what drives your revenue, such as product use, upgrades, and gaining new customers.
- Explore monthly revenue, customer loss, and average revenue per user by groups, uncovering growth areas and risks.
- Monitor how A/B tests, price changes, and marketing efforts affect revenue, guiding future improvements.
Conclusion
SaaS companies are heavily dependent on future revenue. It is, therefore, important to keep track of key metrics as income is spread evenly across a large period of time. To achieve this, customers must be analyzed at every stage of their journey within the business, whether it's during onboarding or churn.